> ## Documentation Index
> Fetch the complete documentation index at: https://docs.zeroruntime.ai/llms.txt
> Use this file to discover all available pages before exploring further.
# Session Analytics
> Review per-session metrics, transcripts, and recording playback on the Dashboard.
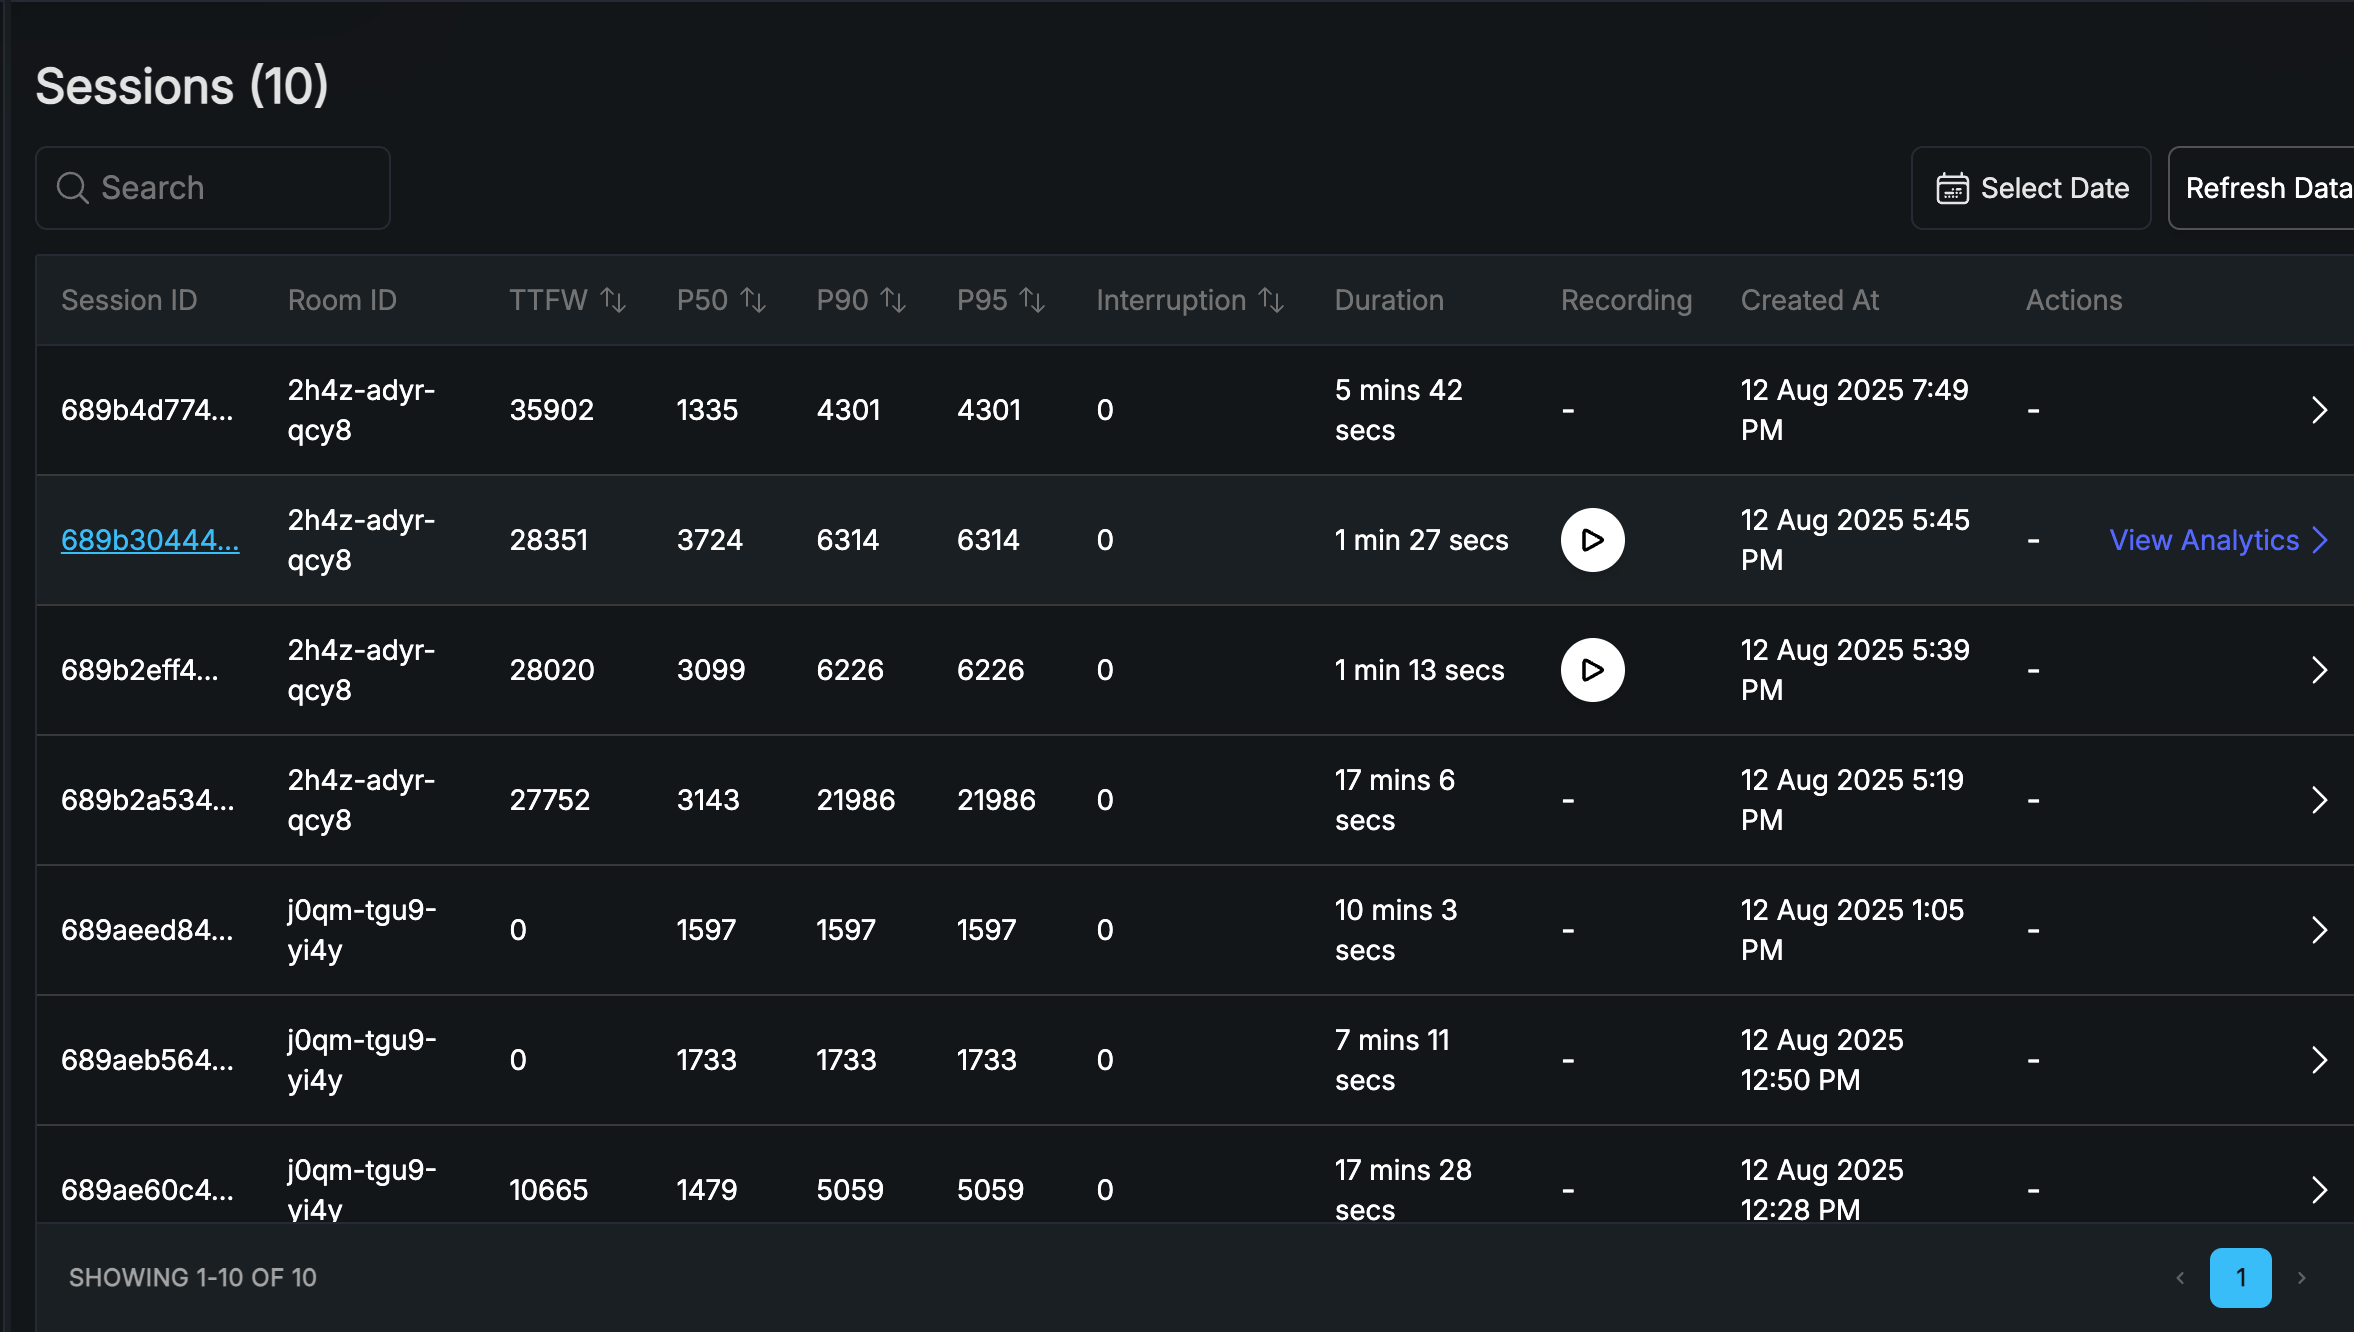
The **Sessions** view on the Zero Runtime Dashboard lists every conversation, each one a unique user-and-agent pairing. Use it to spot slow sessions, frequent interruptions, and failures at a glance.
## Sessions View
| Column | Meaning |
| --------------------- | --------------------------------------------------------------------------------------------------- |
| `Session ID` | Unique identifier for the conversation. |
| `Room ID` | The room the session ran in. |
| `TTFW` | Time to First Word: how long the agent takes to say its first word after the user stops speaking. |
| `P50` / `P90` / `P95` | Response latency percentiles. P90, for example, is the latency that 90% of responses come in under. |
| `Interruption` | Number of times the user interrupted the agent. |
| `Duration` | Total length of the session. |
| `Recording` | Whether the session was recorded, with playback when available. |
| `Created At` | When the session started. |
| `Actions` | Open **View Analytics** for the full session breakdown. |
 ## Session View
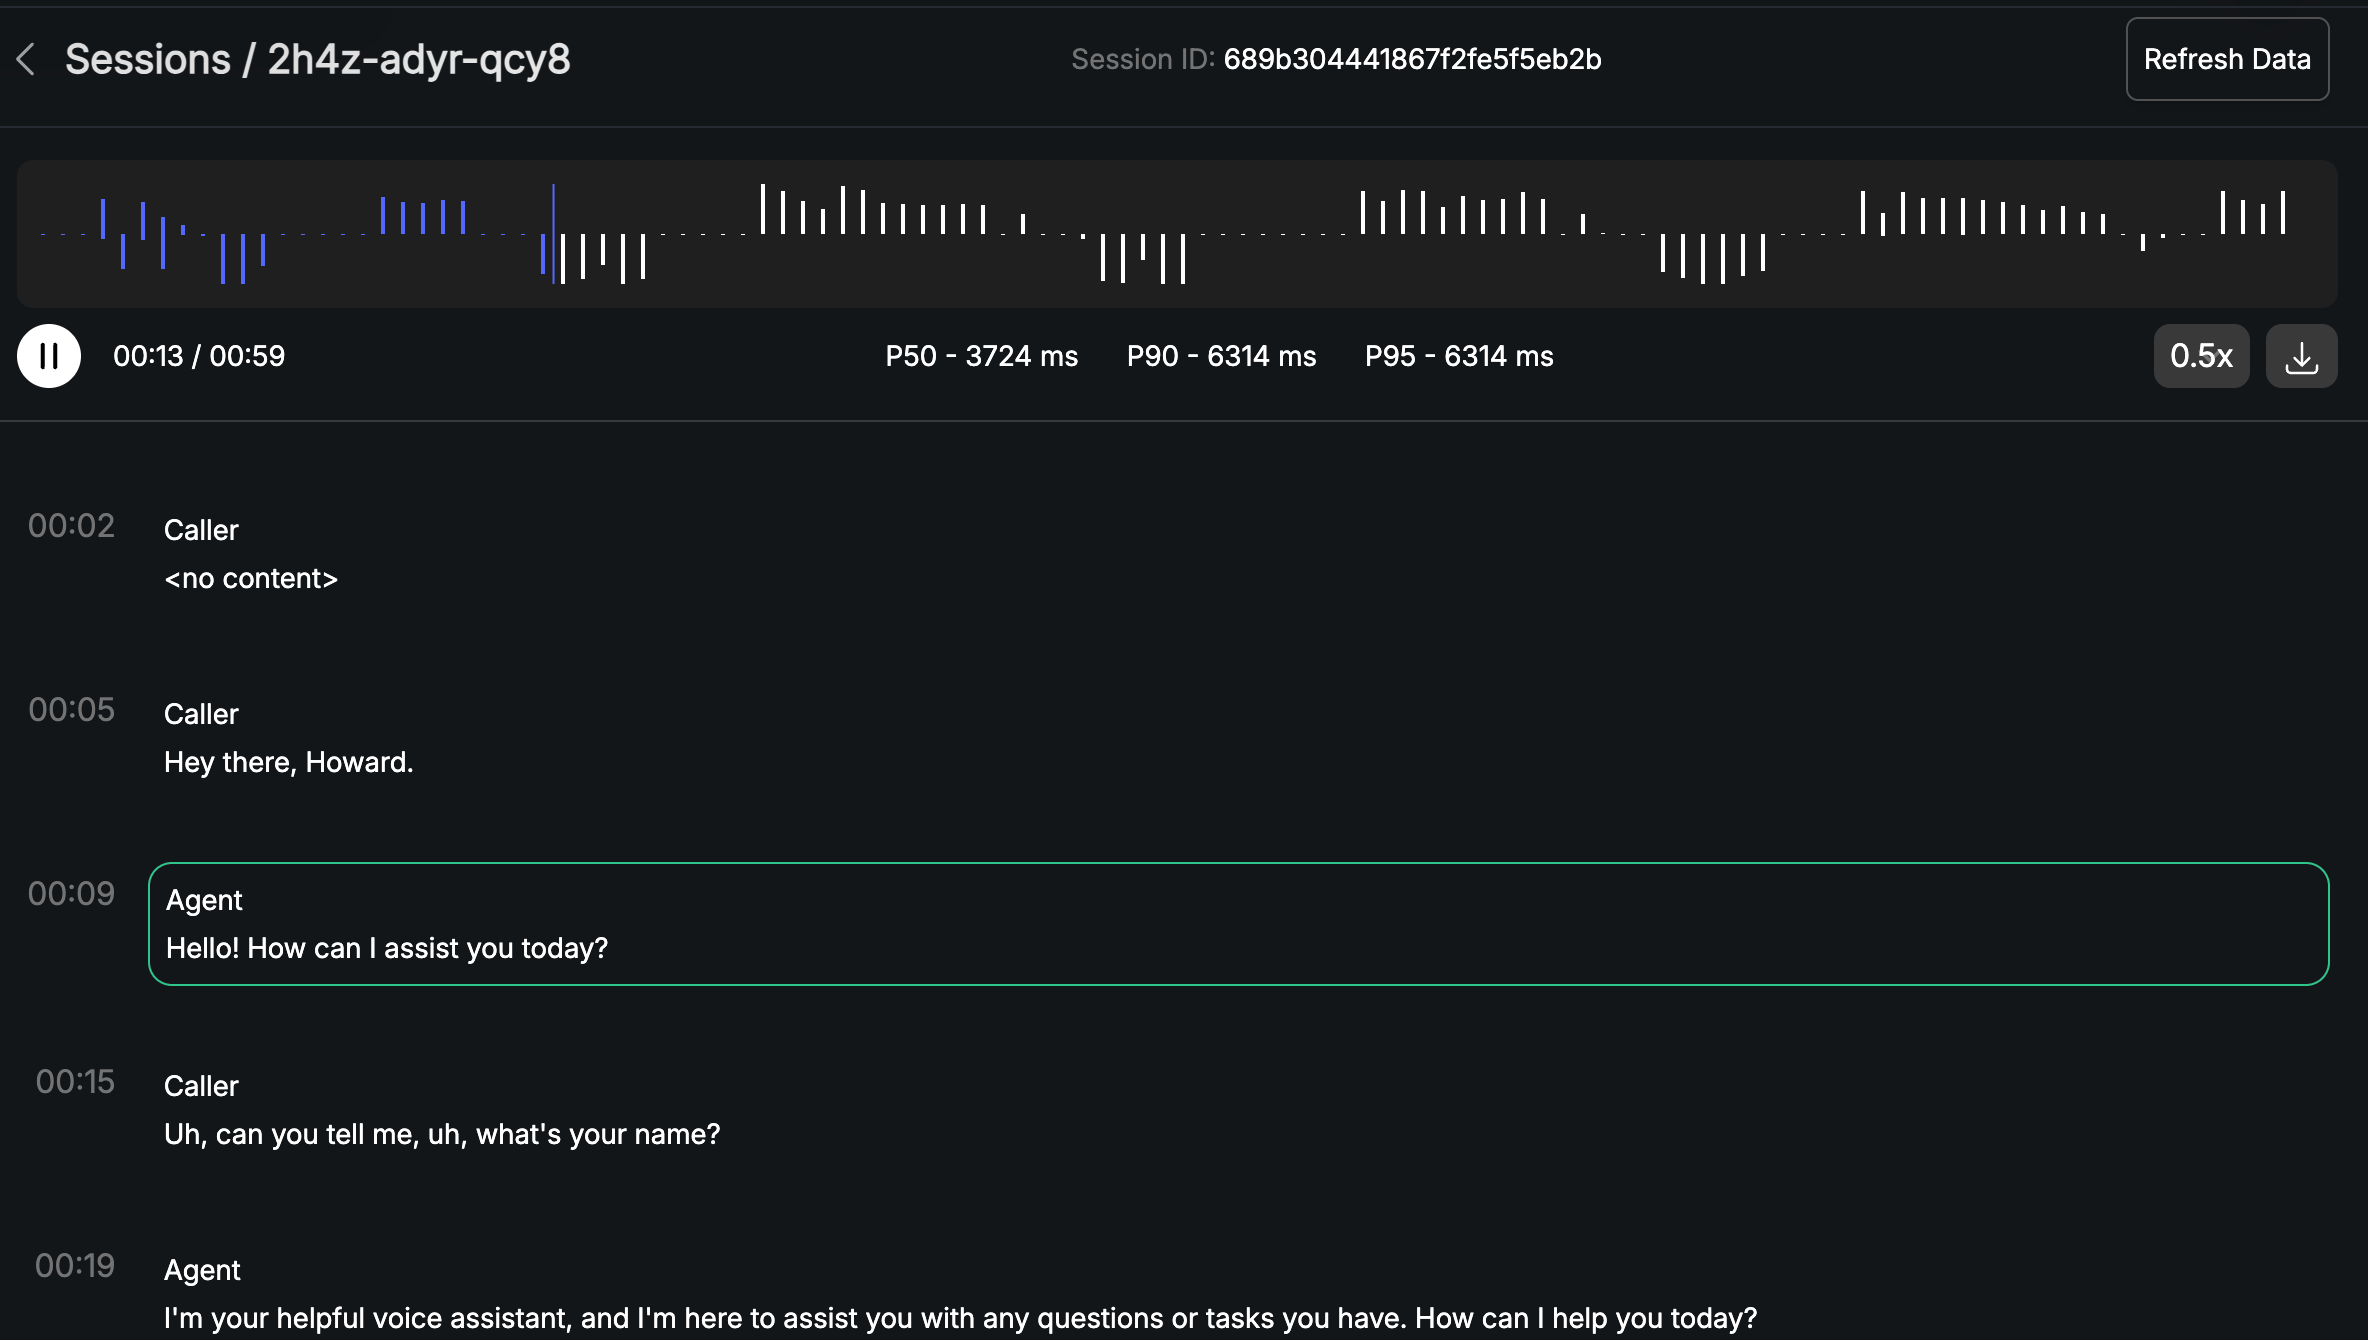
Click **View Analytics** to open the **Session view**. It shows the full transcript with timestamps and speaker labels (Caller and Agent), and plays back the recording with an autoscrolling transcript, so you can review the experience and spot areas to improve.
## Session View
Click **View Analytics** to open the **Session view**. It shows the full transcript with timestamps and speaker labels (Caller and Agent), and plays back the recording with an autoscrolling transcript, so you can review the experience and spot areas to improve.
 ## What's Next
Drill into per-turn traces and spans.
Configure recording and review telemetry on the Dashboard.
## References
#### Examples
Gather per-session analytics.
#### SDK Reference
`Metrics` in the Python API reference.
## What's Next
Drill into per-turn traces and spans.
Configure recording and review telemetry on the Dashboard.
## References
#### Examples
Gather per-session analytics.
#### SDK Reference
`Metrics` in the Python API reference.