> ## Documentation Index
> Fetch the complete documentation index at: https://docs.zeroruntime.ai/llms.txt
> Use this file to discover all available pages before exploring further.
# Trace Insights
> Break a session into traces and spans to find bottlenecks and debug errors.
The **Trace View** on the Dashboard breaks a session into a hierarchy of traces and spans for granular analysis. Use it to find where time goes in a turn and to debug errors across STT, LLM, TTS, and tool calls.
The Trace View offers an even deeper level of insight, breaking down the entire session into a hierarchical structure of traces and spans.
## Session Configuration
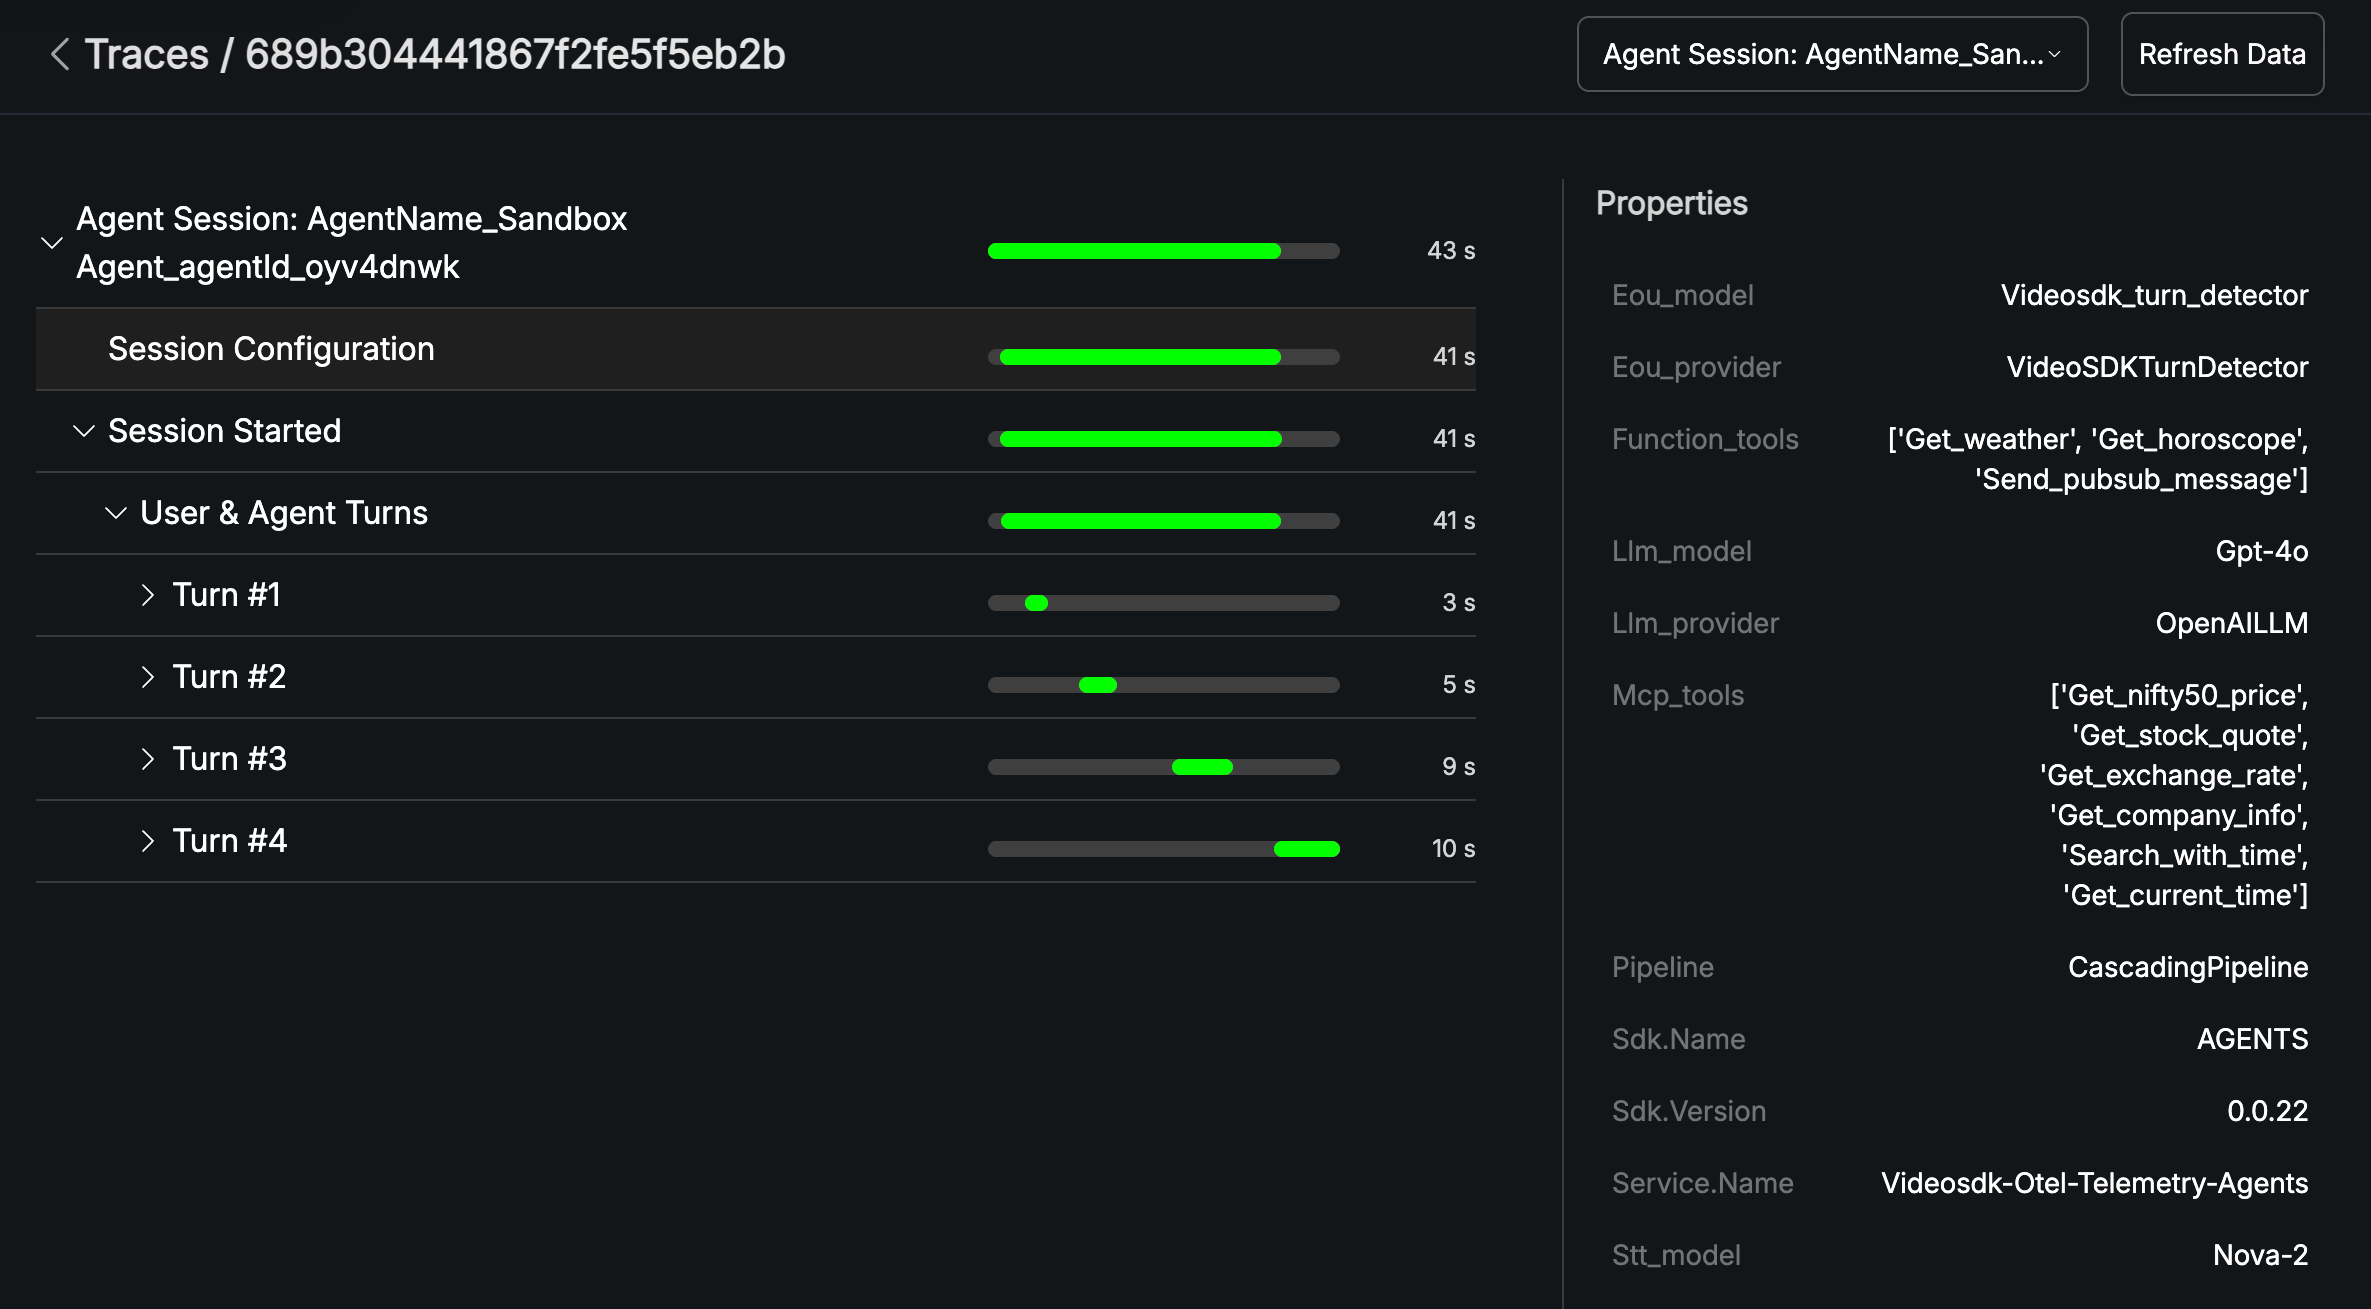
At the top level, the **Session Configuration** details every parameter the agent was initialized with: the STT, LLM, and TTS models, plus any function tools and MCP tools. Use it to reproduce and debug agent behavior.
 ## User & Agent Turns
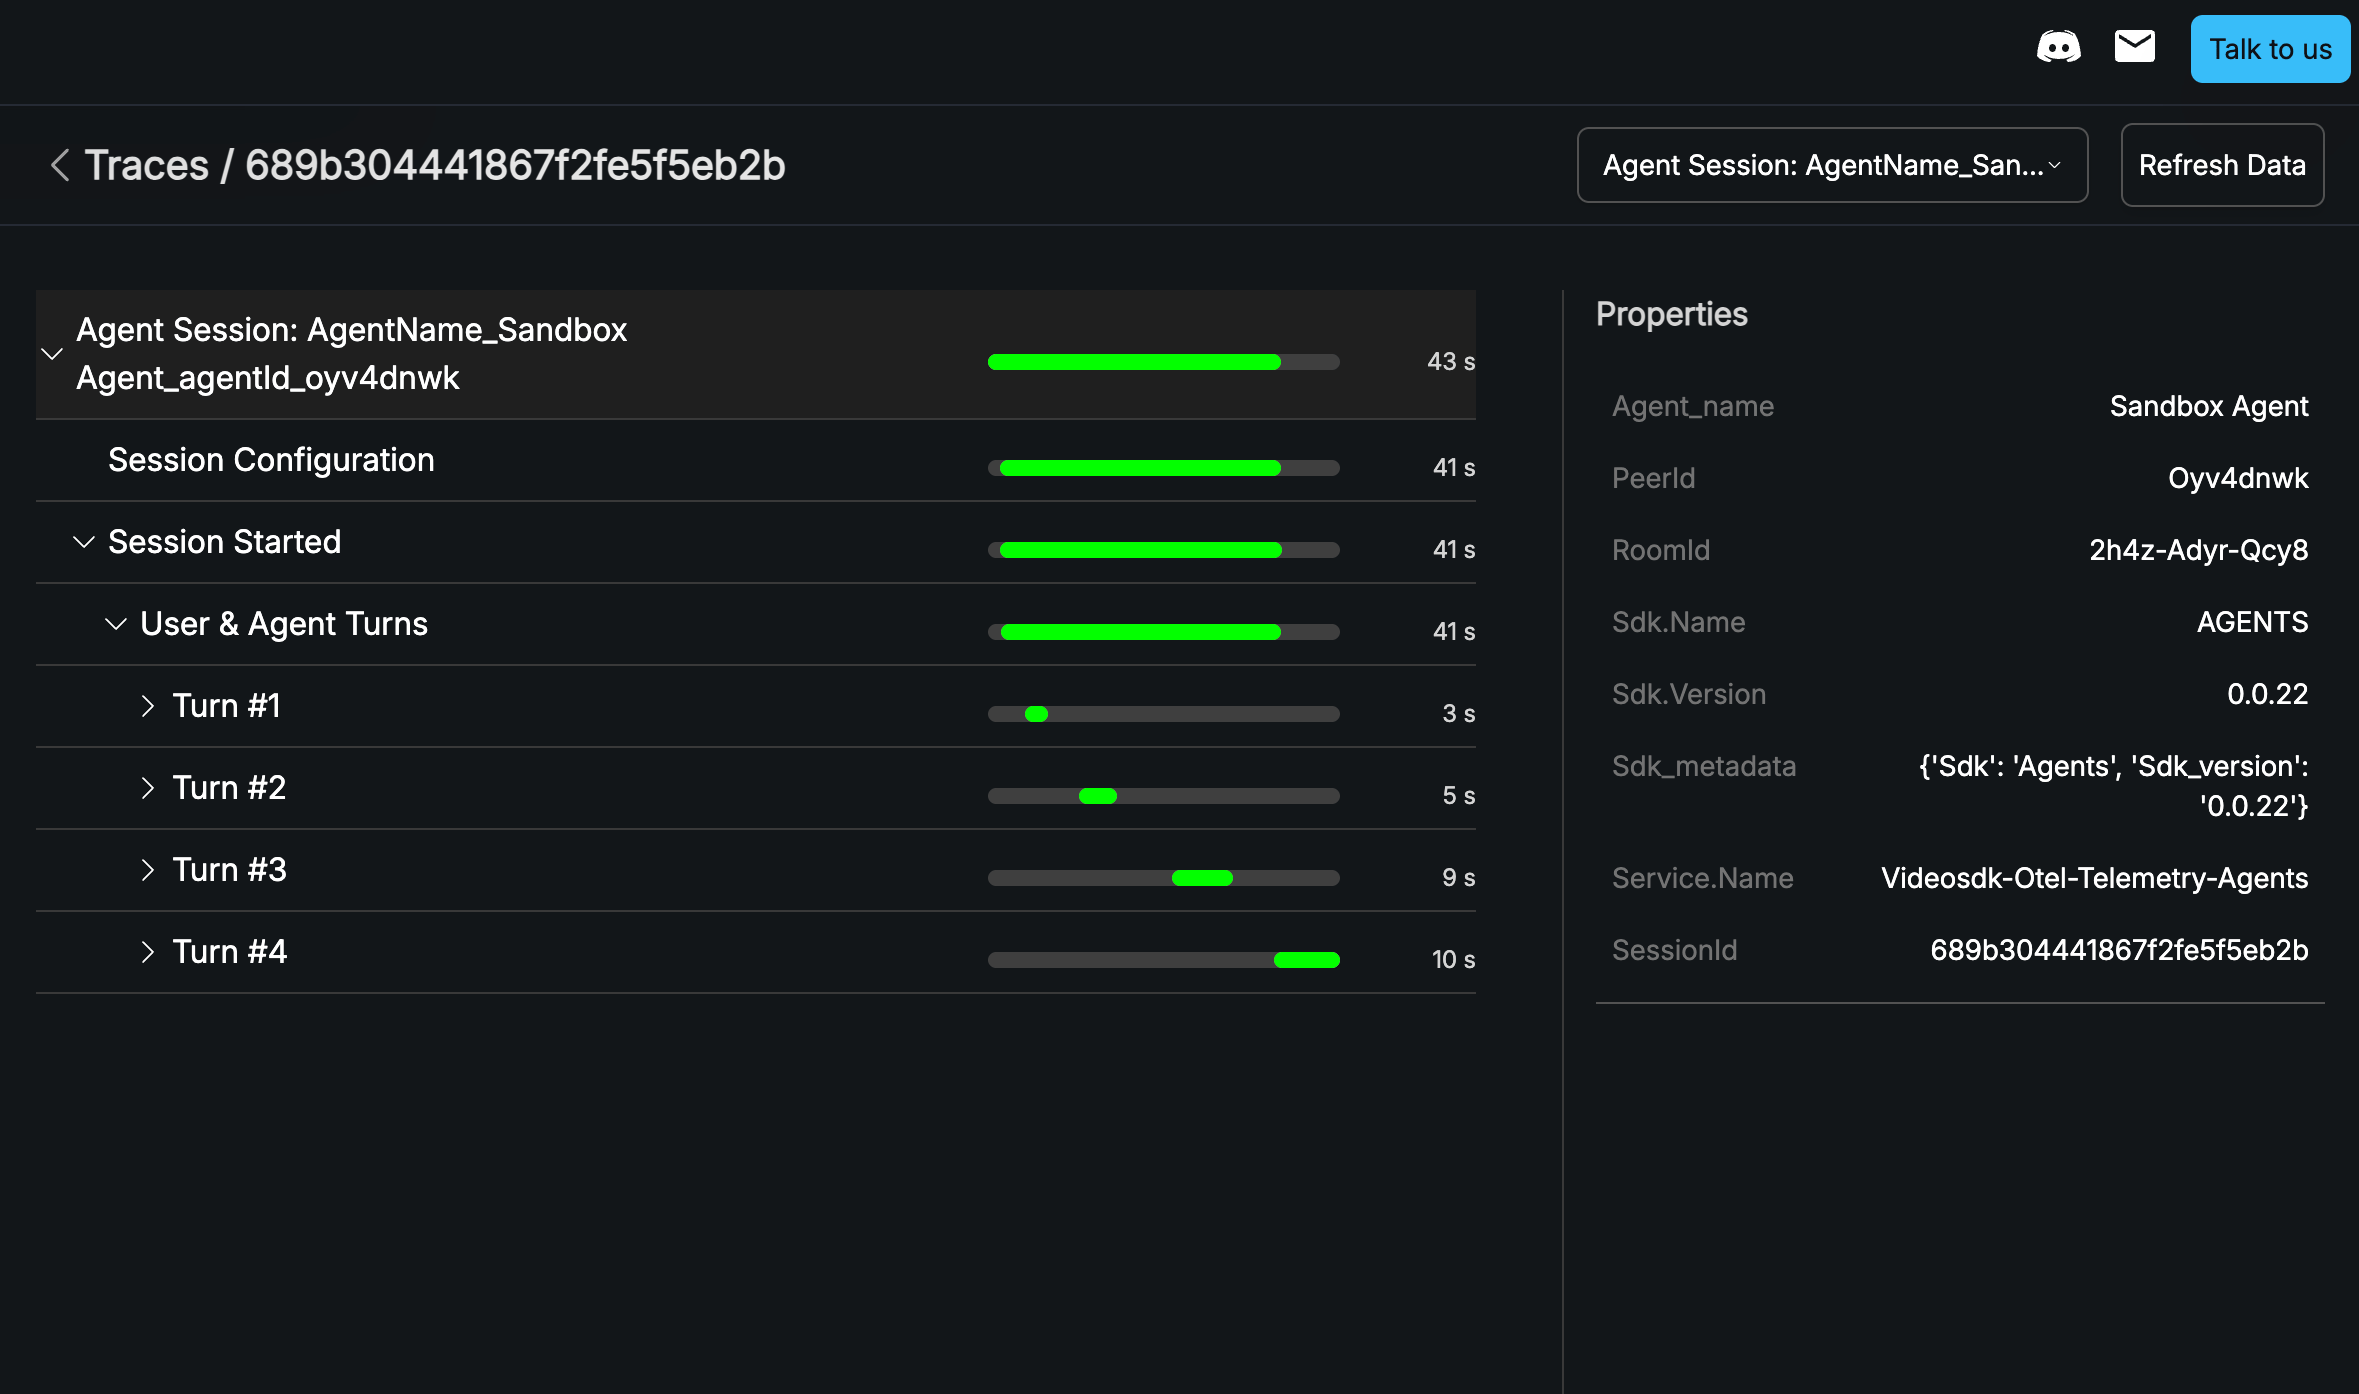
The core of the Trace View is the breakdown of the conversation into **User & Agent Turns**. Each turn is a single exchange between the user and the agent, with a detailed timeline of these spans:
| Span | Measures |
| ------------------- | ------------------------------------------------- |
| STT | Speech-to-text transcription duration. |
| EOU | End-of-utterance detection timing. |
| LLM | Response generation latency. |
| TTS | Text-to-speech synthesis duration. |
| Time to First Byte | Initial delay before the agent starts responding. |
| User Input Speech | How long the user spoke. |
| Agent Output Speech | How long the agent's response played. |
## User & Agent Turns
The core of the Trace View is the breakdown of the conversation into **User & Agent Turns**. Each turn is a single exchange between the user and the agent, with a detailed timeline of these spans:
| Span | Measures |
| ------------------- | ------------------------------------------------- |
| STT | Speech-to-text transcription duration. |
| EOU | End-of-utterance detection timing. |
| LLM | Response generation latency. |
| TTS | Text-to-speech synthesis duration. |
| Time to First Byte | Initial delay before the agent starts responding. |
| User Input Speech | How long the user spoke. |
| Agent Output Speech | How long the agent's response played. |
 ## Turn Properties
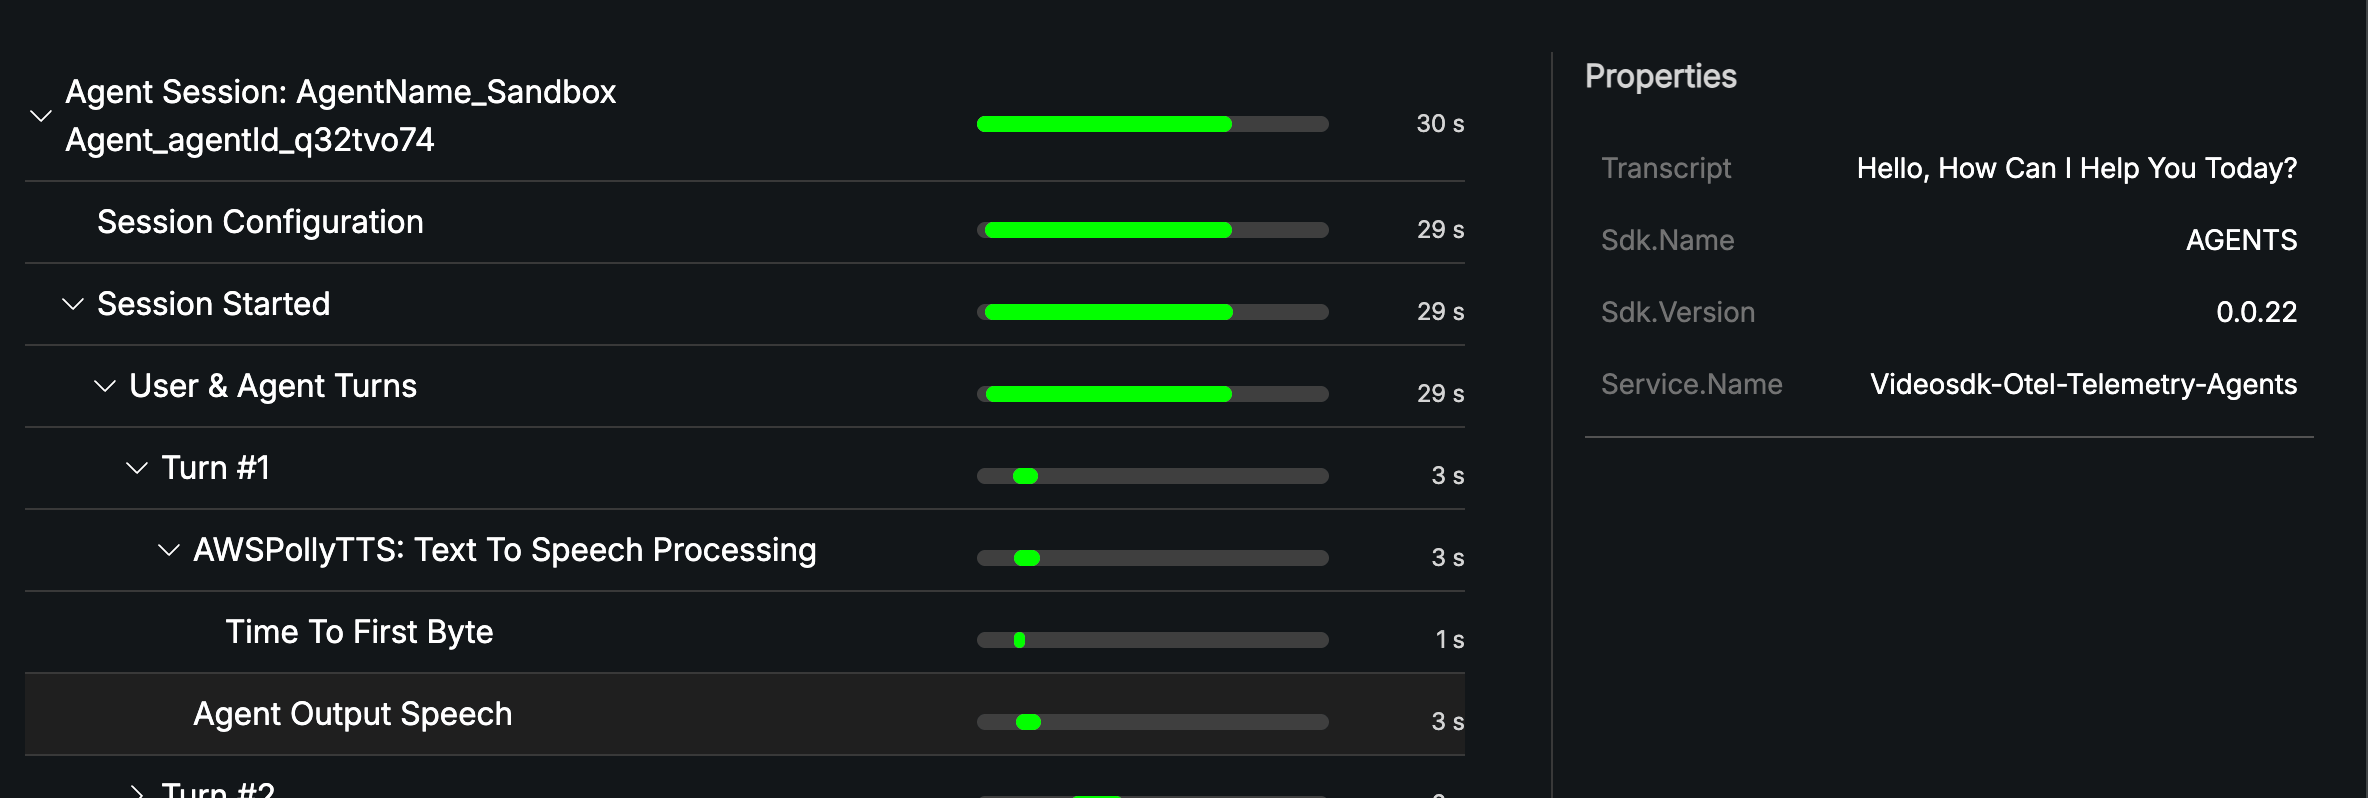
For each turn, inspect the properties of the components involved: the transcript of the user's input, the response from the LLM, and any errors that occurred.
## Turn Properties
For each turn, inspect the properties of the components involved: the transcript of the user's input, the response from the LLM, and any errors that occurred.
 ## Tool Calls
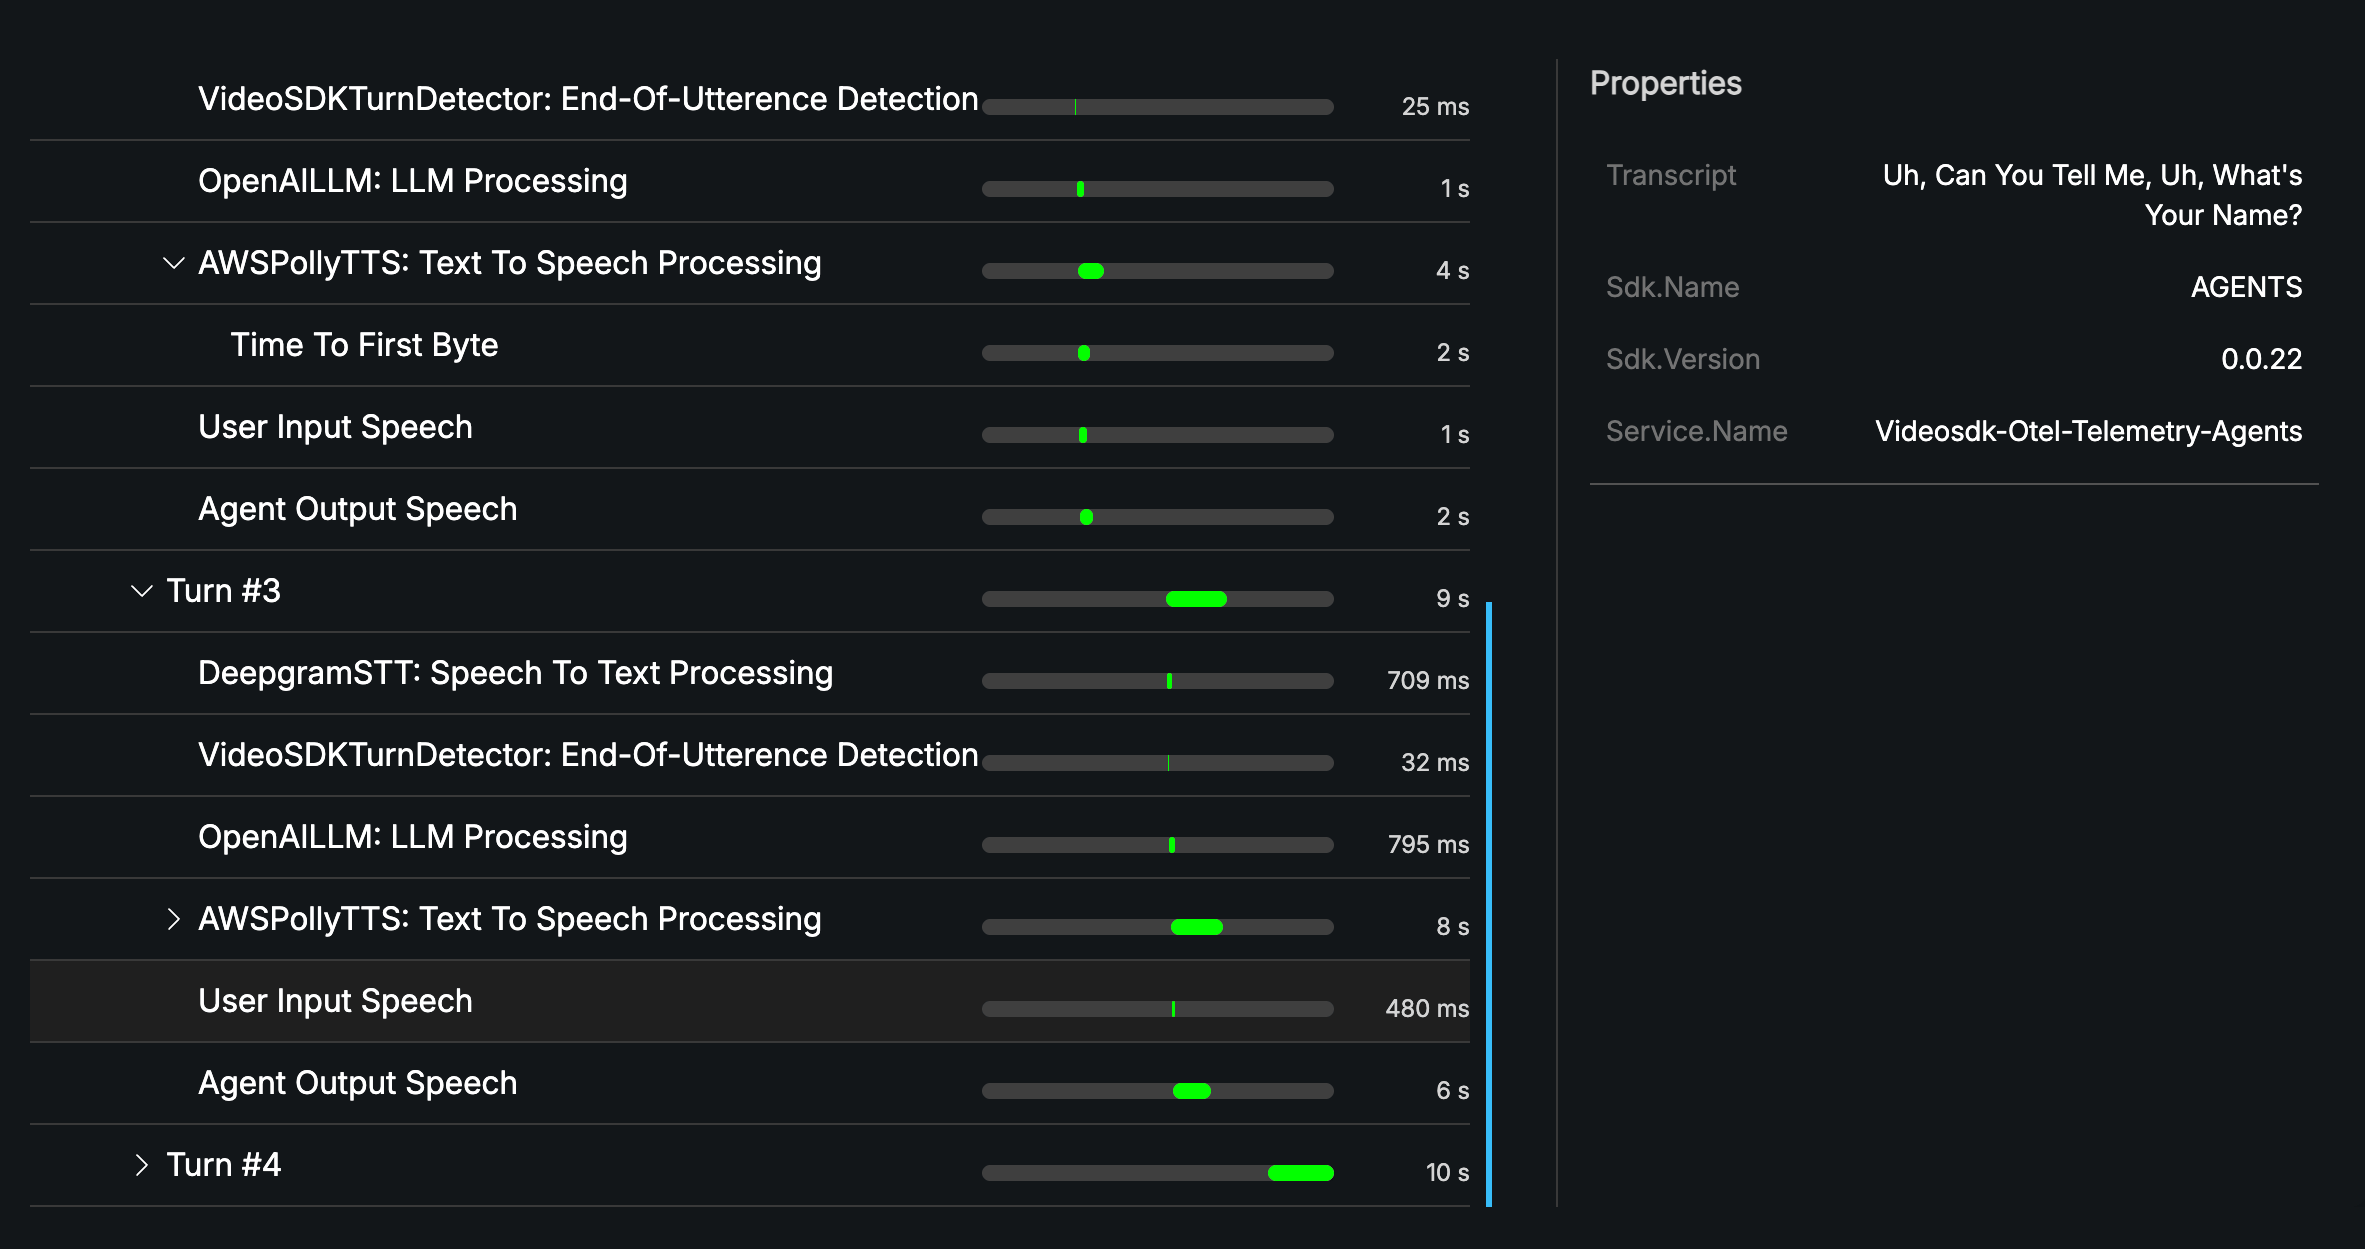
When the LLM invokes a tool, the Trace View shows details about the call, including the tool's name and the parameters it was called with. Use it to validate integrations and debug tool behavior.
## Tool Calls
When the LLM invokes a tool, the Trace View shows details about the call, including the tool's name and the parameters it was called with. Use it to validate integrations and debug tool behavior.
 ## What's Next
View per-turn traces and metrics on the Dashboard.
See session-level metrics and transcripts.
## References
#### Examples
Emit traces from a session.
#### SDK Reference
`Metrics` in the Python API reference.
## What's Next
View per-turn traces and metrics on the Dashboard.
See session-level metrics and transcripts.
## References
#### Examples
Emit traces from a session.
#### SDK Reference
`Metrics` in the Python API reference.