

log_level, read the logs of any session on the Dashboard, and can ship them to your own observability stack.
Set the log level
Setlog_level on the room’s Observability to choose which records the agent emits. The agent logs records at that level and above.
View logs on the Dashboard
Every session’s logs are kept on the Zero Runtime Dashboard. Open Sessions, click Actions > View on a session, then select the Logs tab. Logs are listed newest first.
Use Showing at the bottom of the table to set how many records appear on a page, and Previous and Next to page through the rest. Only records at or above the session’s
log_level appear here.
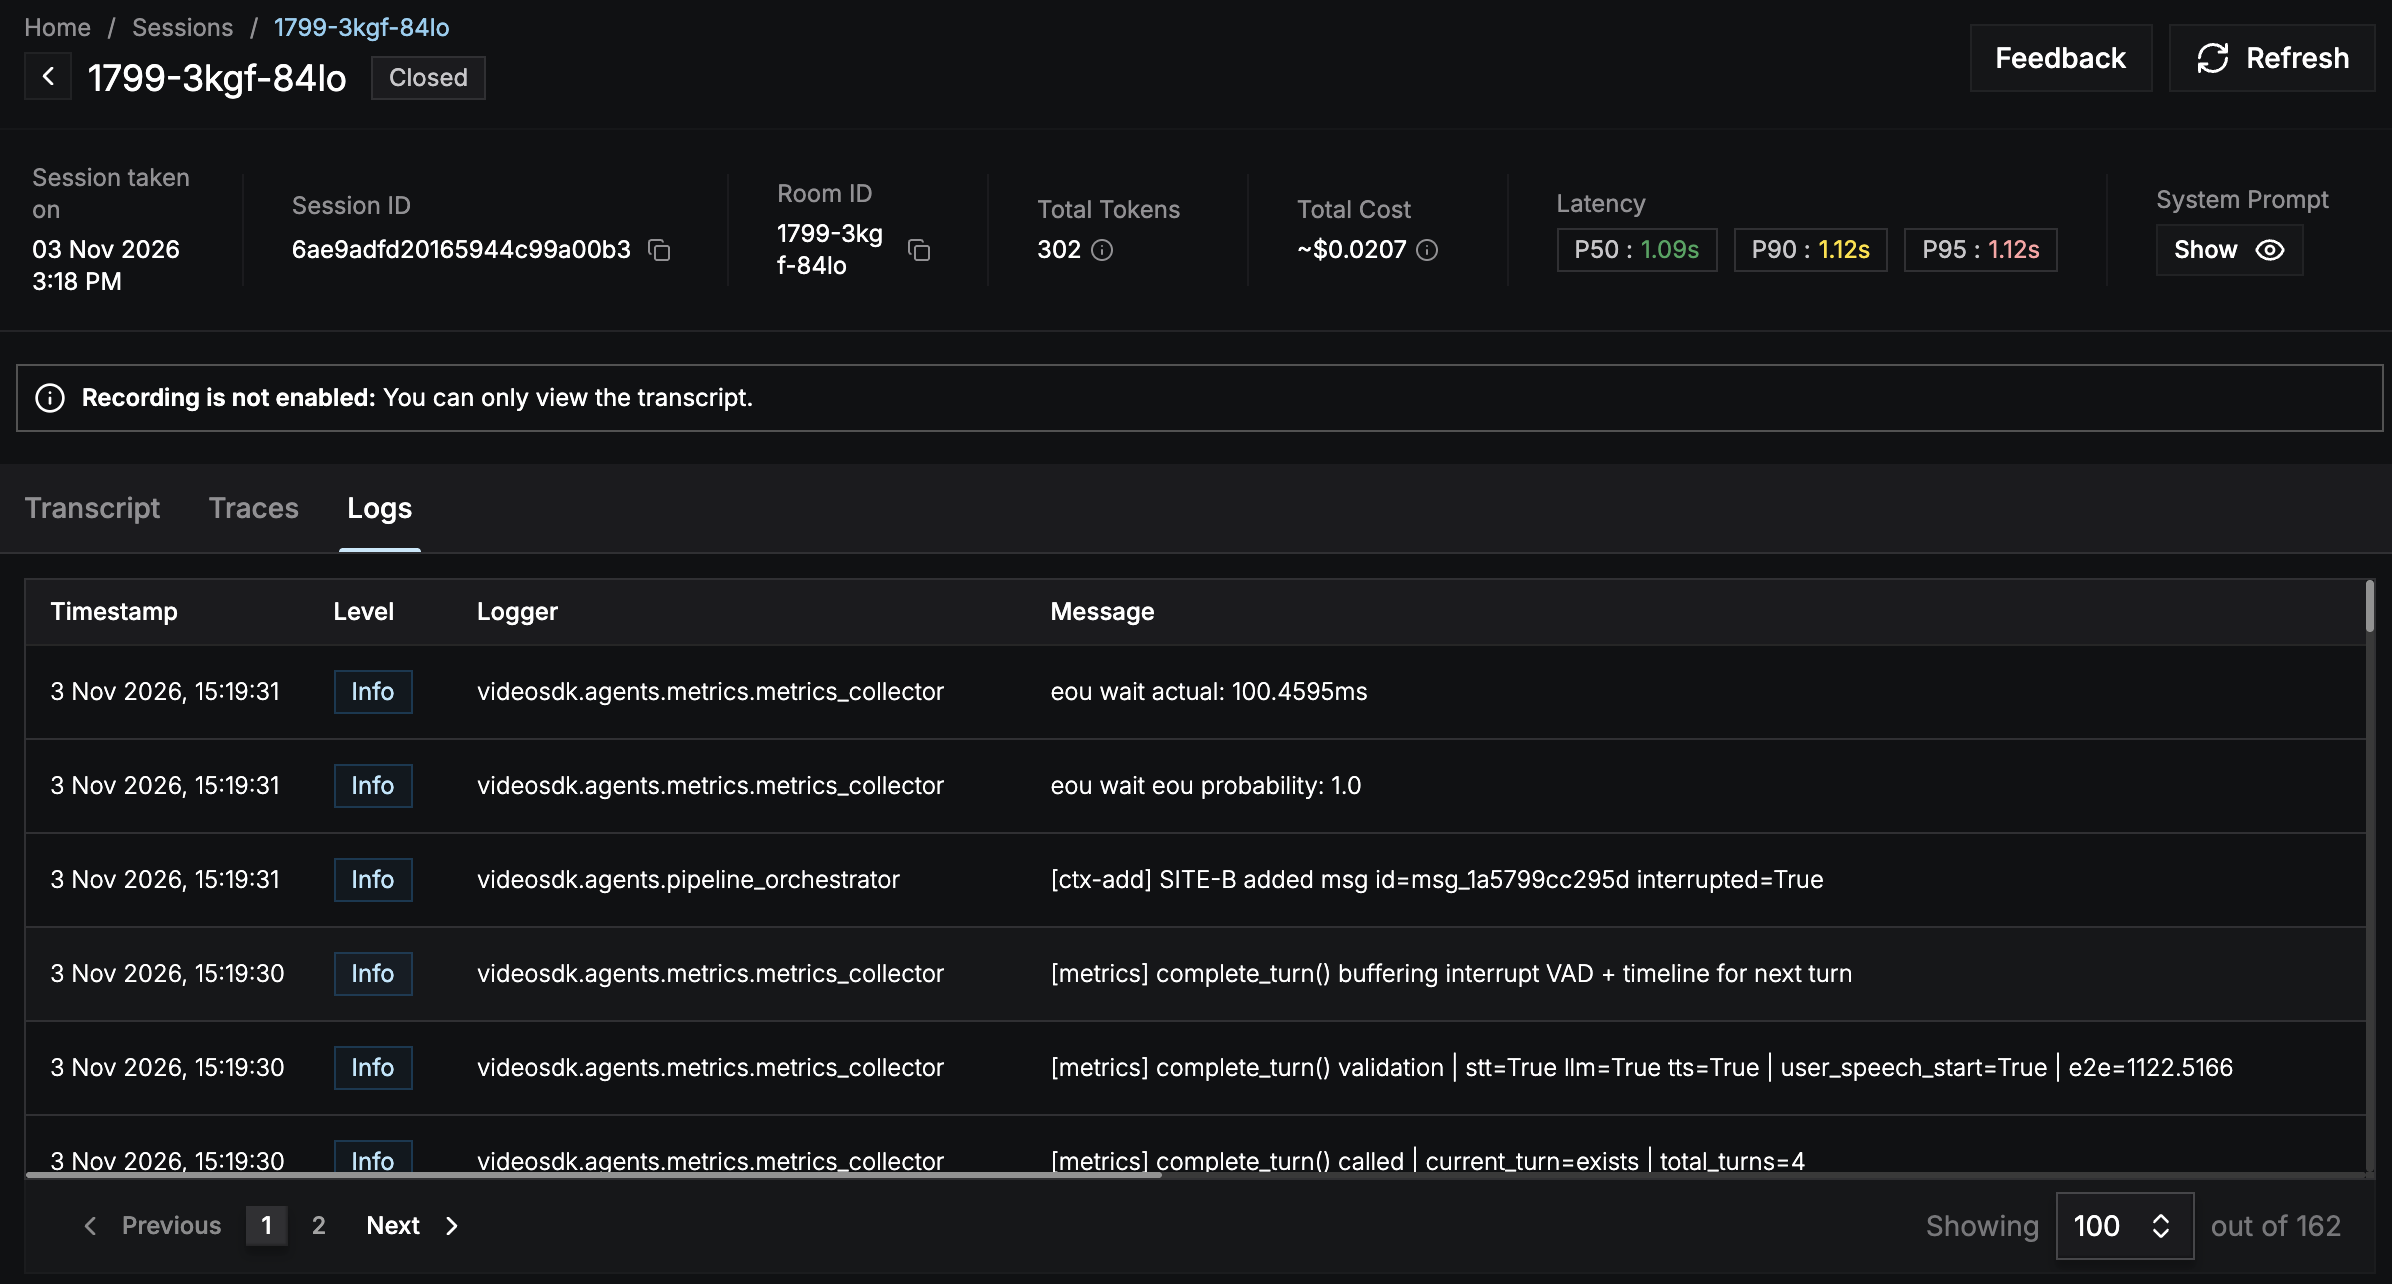
The Logs tab of the Session view, listing each record's timestamp, level, logger, and message
Export logs to your observability stack
To send logs to your own observability stack, such as Datadog, SigNoz, or New Relic, setlogs on the room’s Observability to an Exporter that points at your collector’s OpenTelemetry (OTLP) endpoint. log_level applies to exported logs too.
Room on serve() to apply it to every session, or on invoke() to apply it to one session.
Leaving
logs unset is not the same as turning it off. An unset stream follows the runtime’s default settings. To stop exporting logs, pass Exporter(enabled=False).What’s Next
Metrics
Read per-stage latency and token usage.
Traces
Follow each turn span by span and export the spans.
References
- Python
- Node JS
Examples
Observability Hooks
Configure observability for a session.