

Get metrics for each stage
Register a hook onpipeline.metrics for the stage you want. Each hook fires once per turn, when that stage finishes, and receives the stage’s metrics as a dictionary. Hooks only observe: they never change what the pipeline does, so you can register as many as you need.
For every field and a complete example per stage, see Observability Hooks.
View metrics on the Dashboard
You don’t need hooks to see metrics. Zero Runtime records them for every session and shows them on the Sessions page of the Zero Runtime Dashboard. Each session lists its latency percentiles, total tokens, and total cost, and the transcript shows the latency of every turn: STT and end-of-utterance latency on user messages, TTS and end-to-end latency on agent messages.Session List View
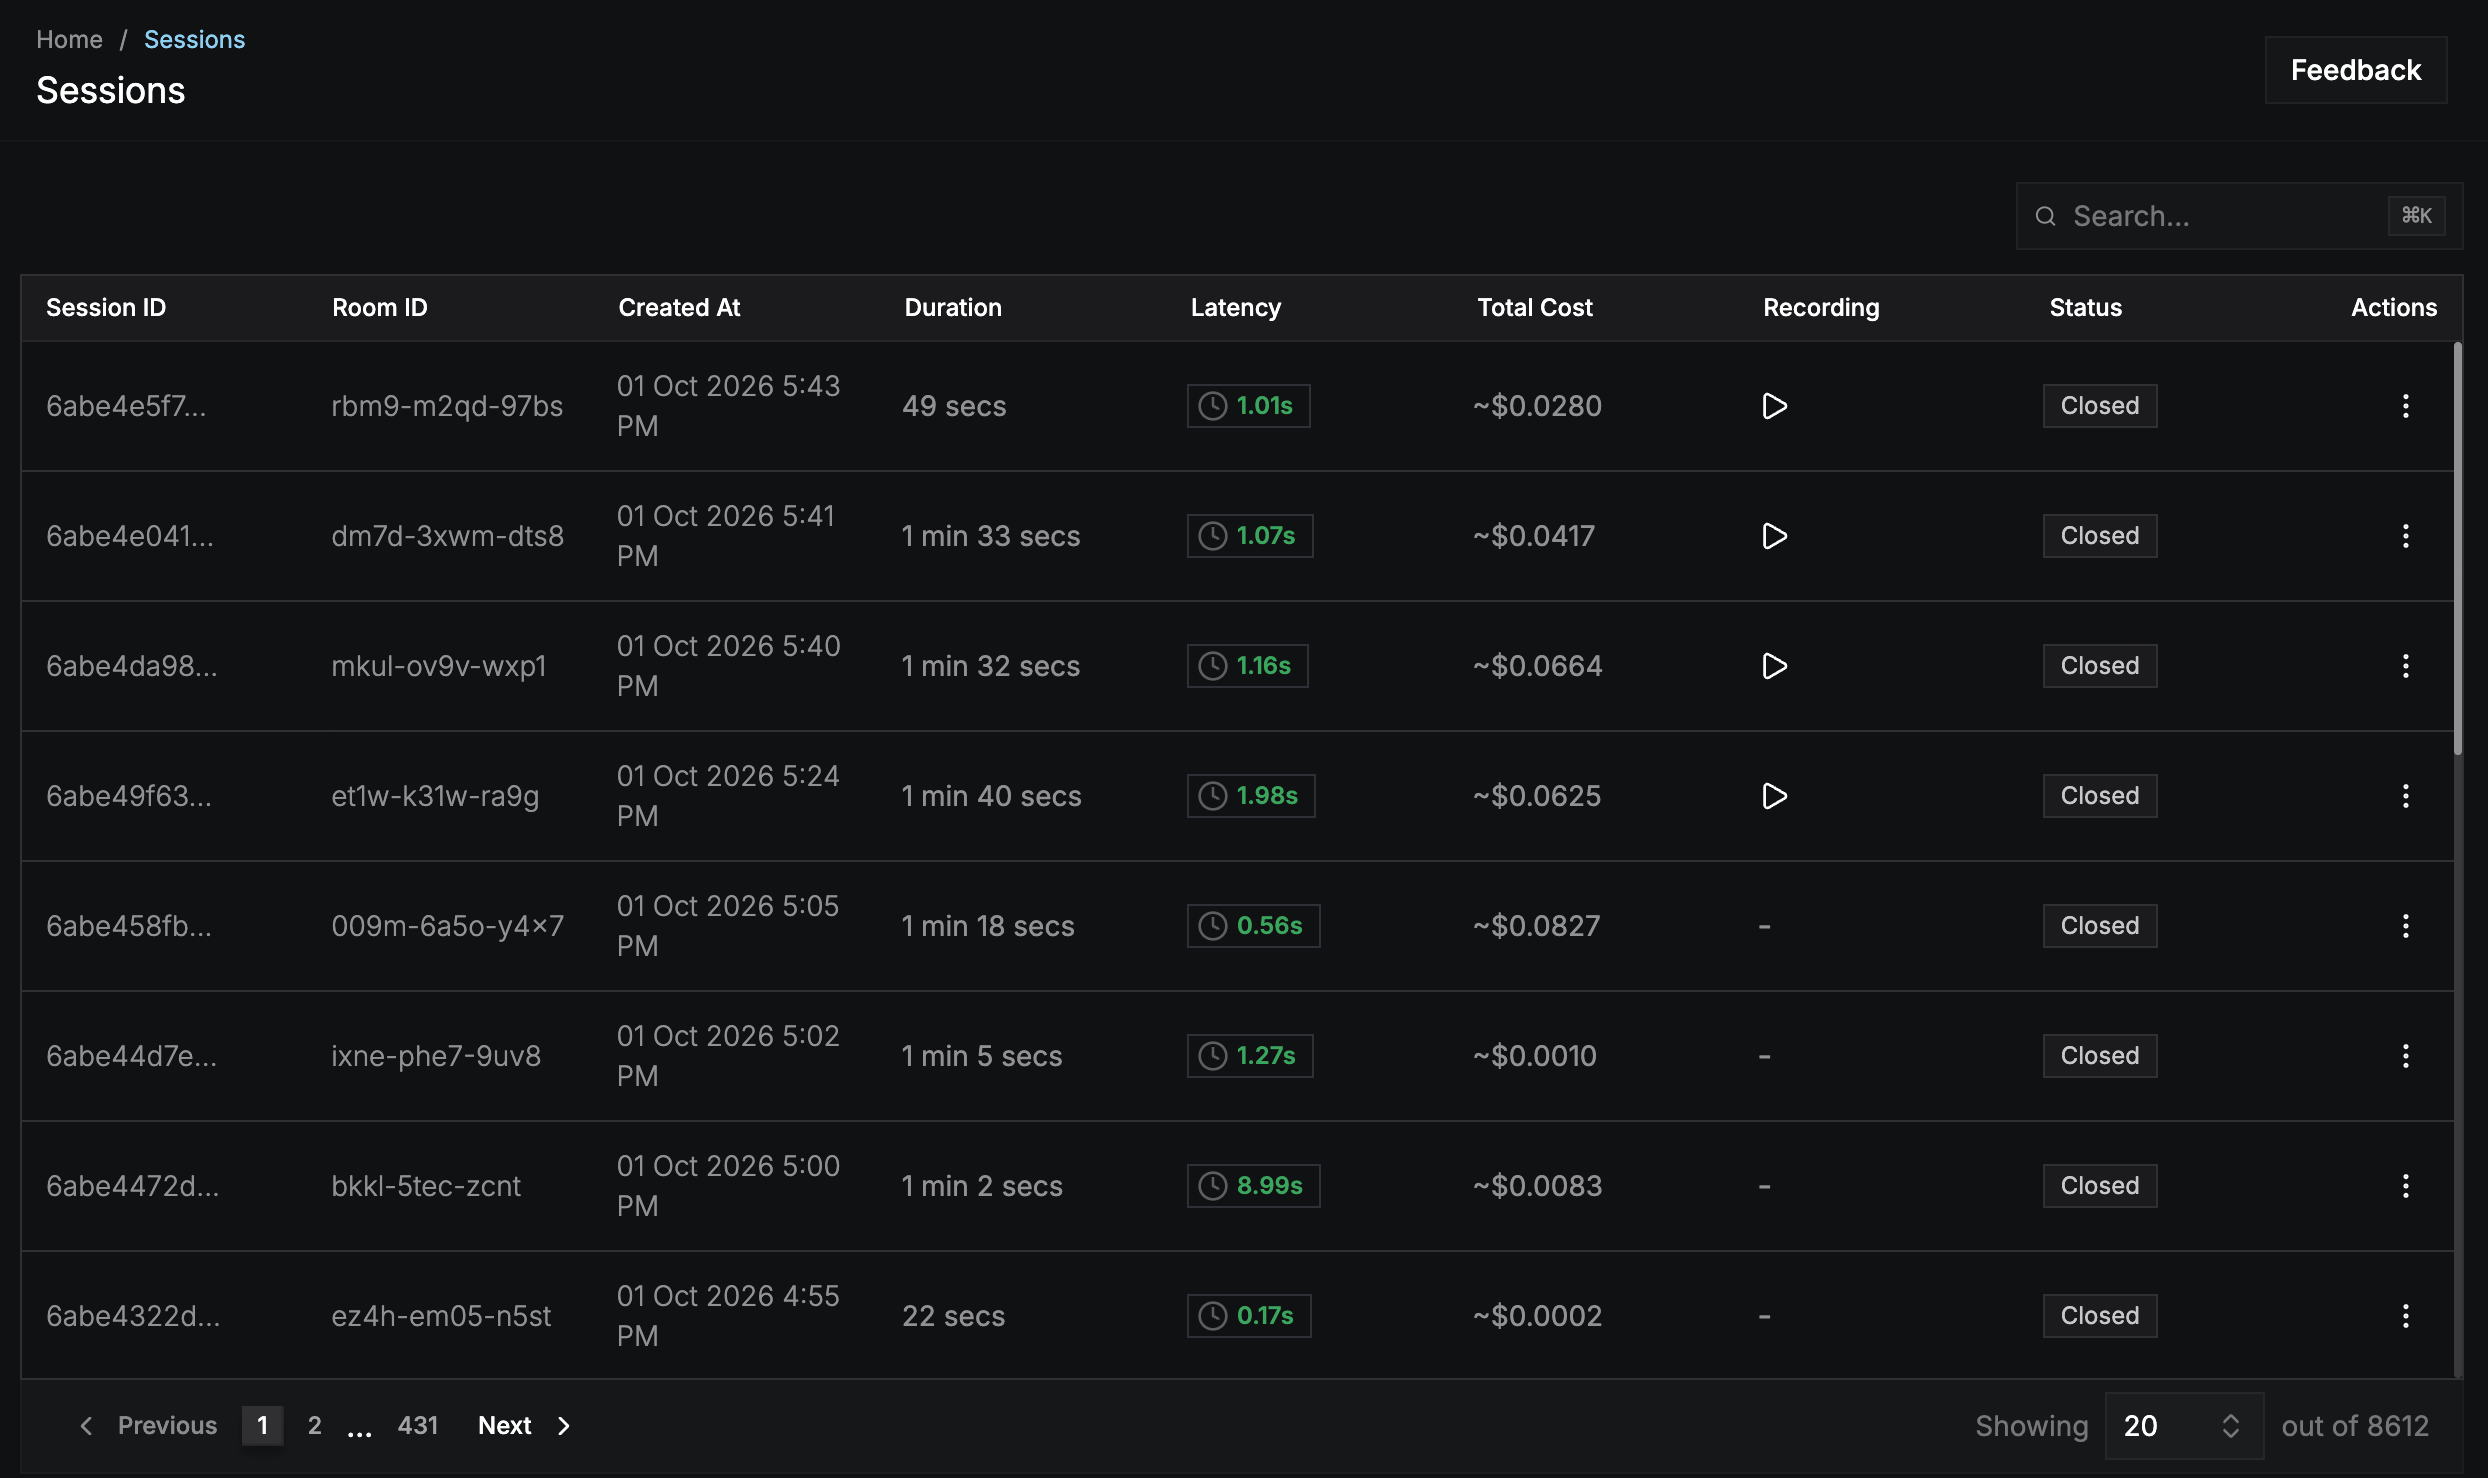
Sessions list on the Zero Runtime Dashboard
Session Transcript View
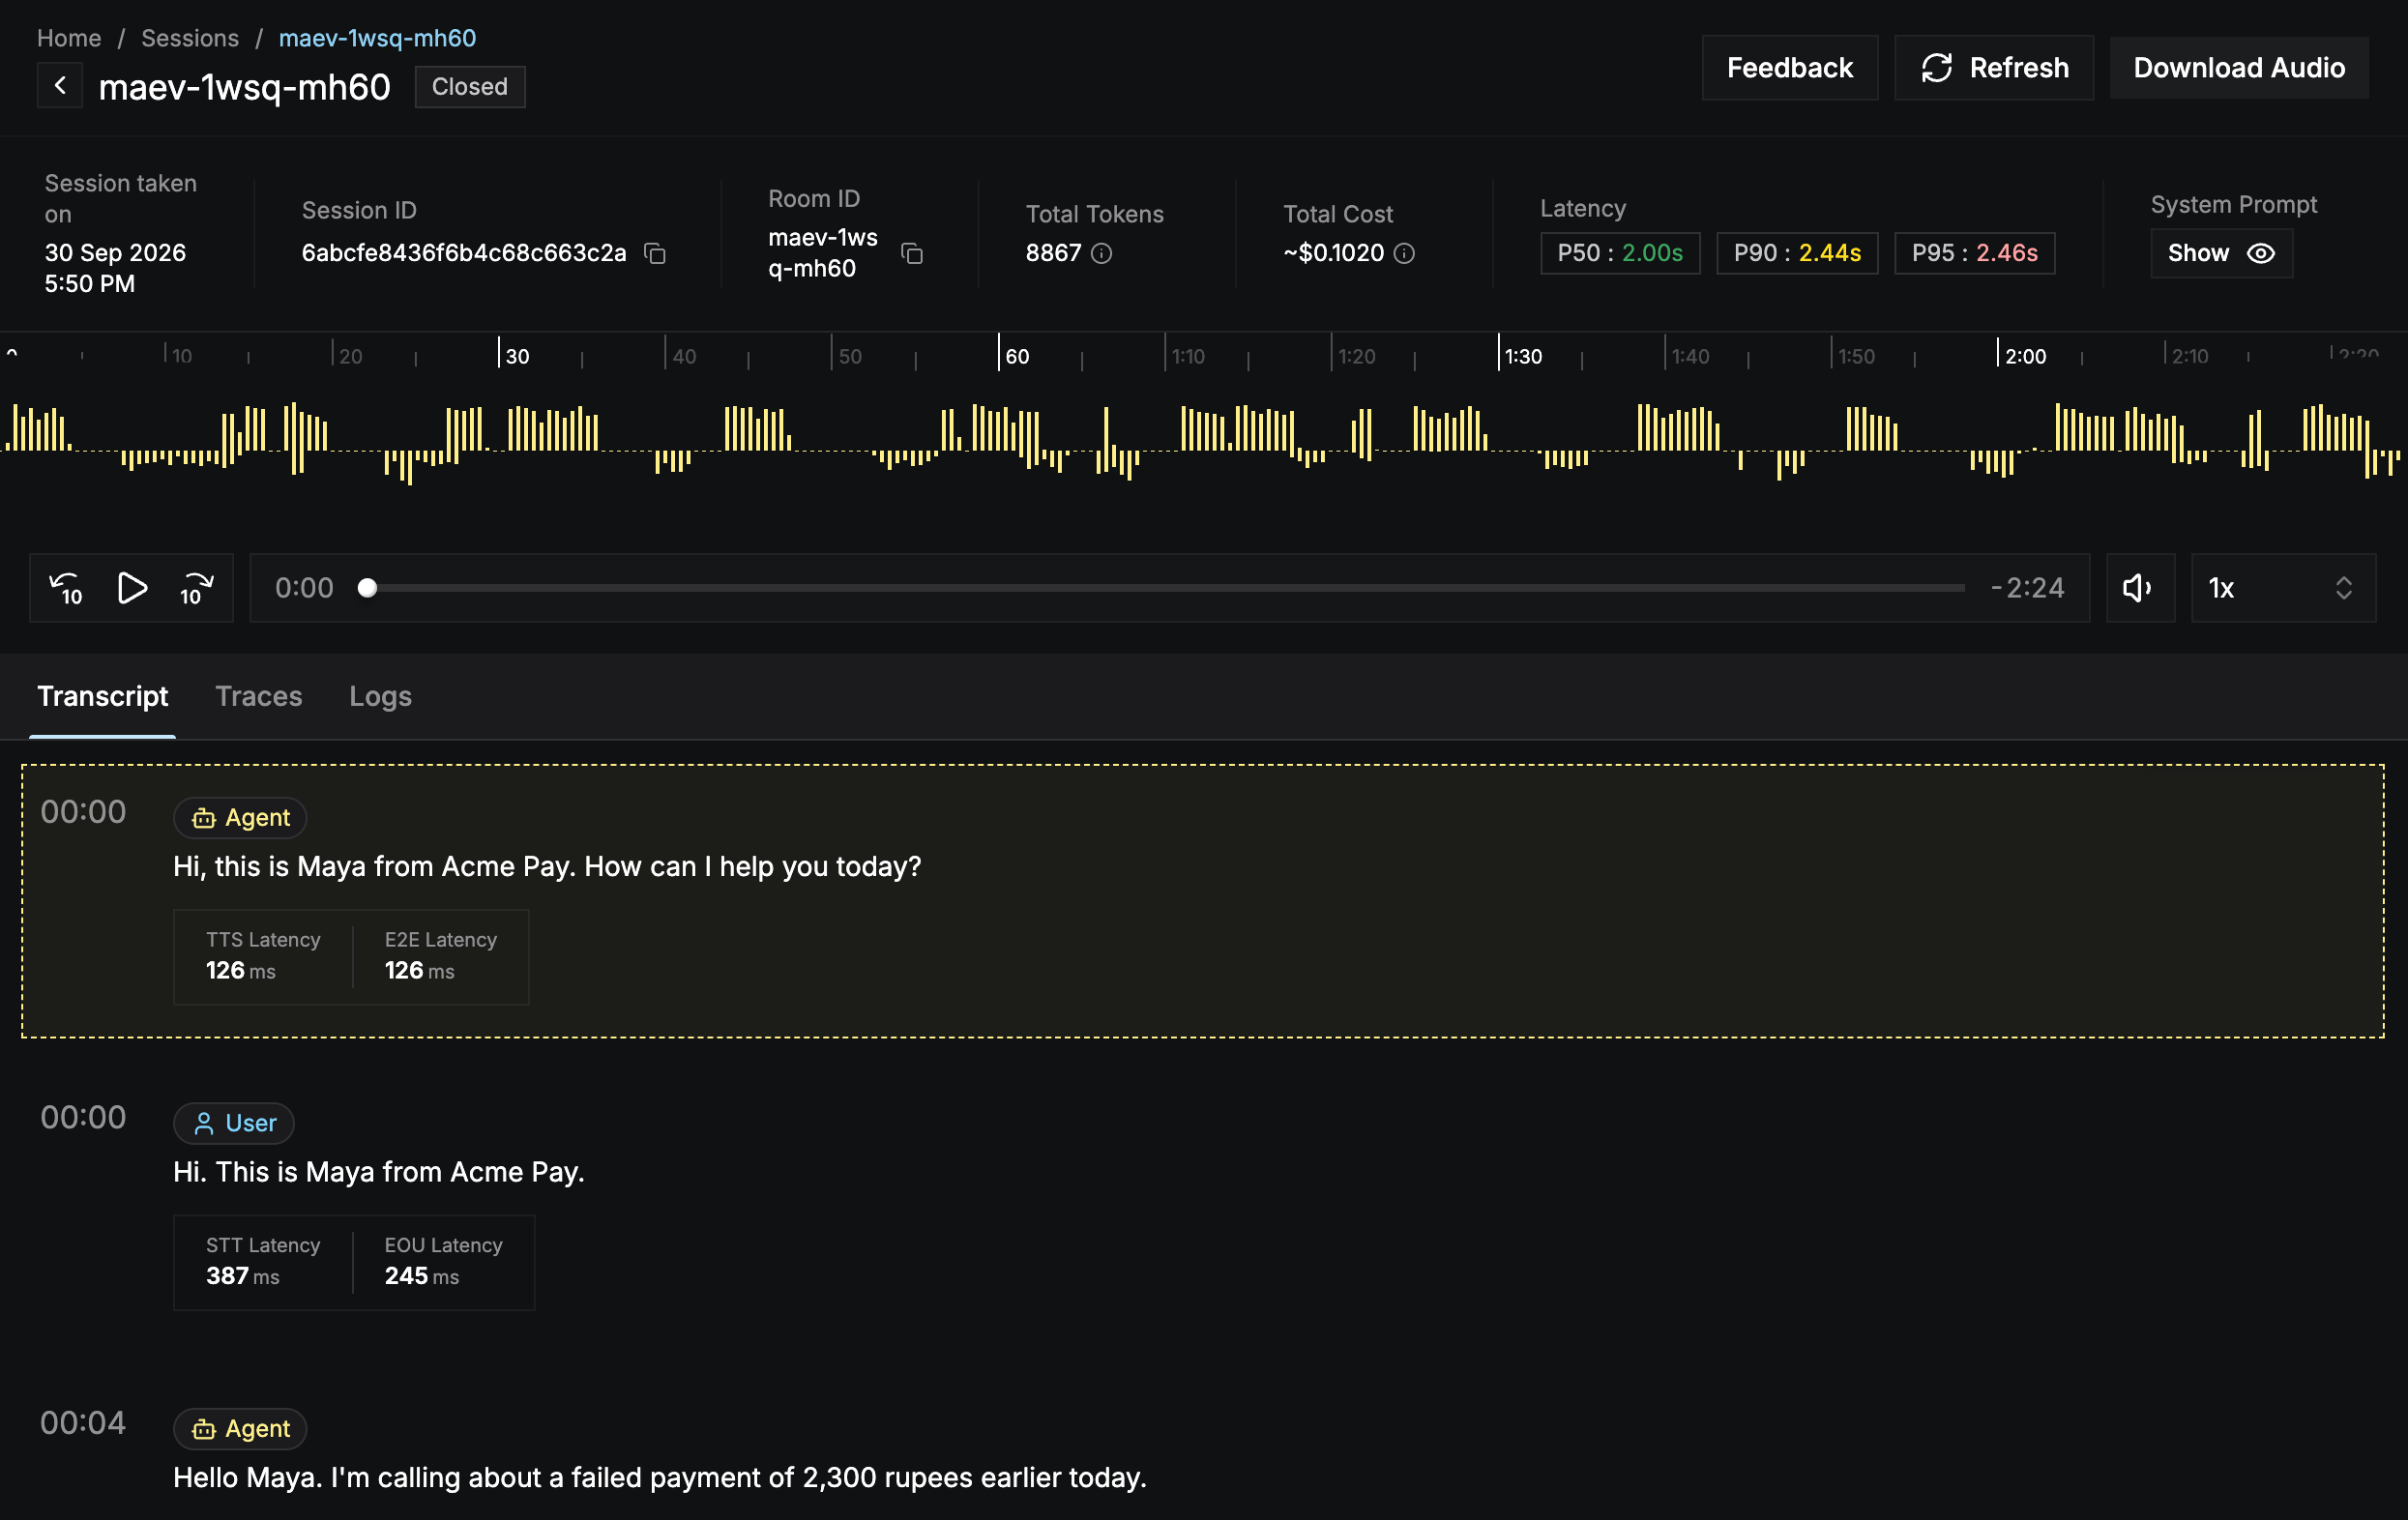
Session view with the transcript, per-message latency, and recording playback
Export metrics to your observability stack
To send metrics to your own observability stack, such as Datadog, SigNoz, or New Relic, setmetrics on the room’s Observability to an Exporter that points at your collector’s OpenTelemetry (OTLP) endpoint.
Room on serve() to apply it to every session, or on invoke() to apply it to one session.
Leaving
metrics unset is not the same as turning it off. An unset stream follows the runtime’s default settings. To stop exporting metrics, pass Exporter(enabled=False).What’s Next
Logs
Set the log level and ship agent logs to your stack.
Traces
Follow each turn span by span and export the spans.
Observability Hooks
Every metrics field, with an example per stage.
References
- Python
- Node JS
Examples
Observability Hooks
Read per-stage metrics with pipeline hooks.