

View traces on the Dashboard
Traces are recorded for every session and shown in the Traces tab of the Session view on the Zero Runtime Dashboard. Open Sessions, click Actions > View on a session, then select Traces.
Select any span to inspect its properties in the Properties panel.
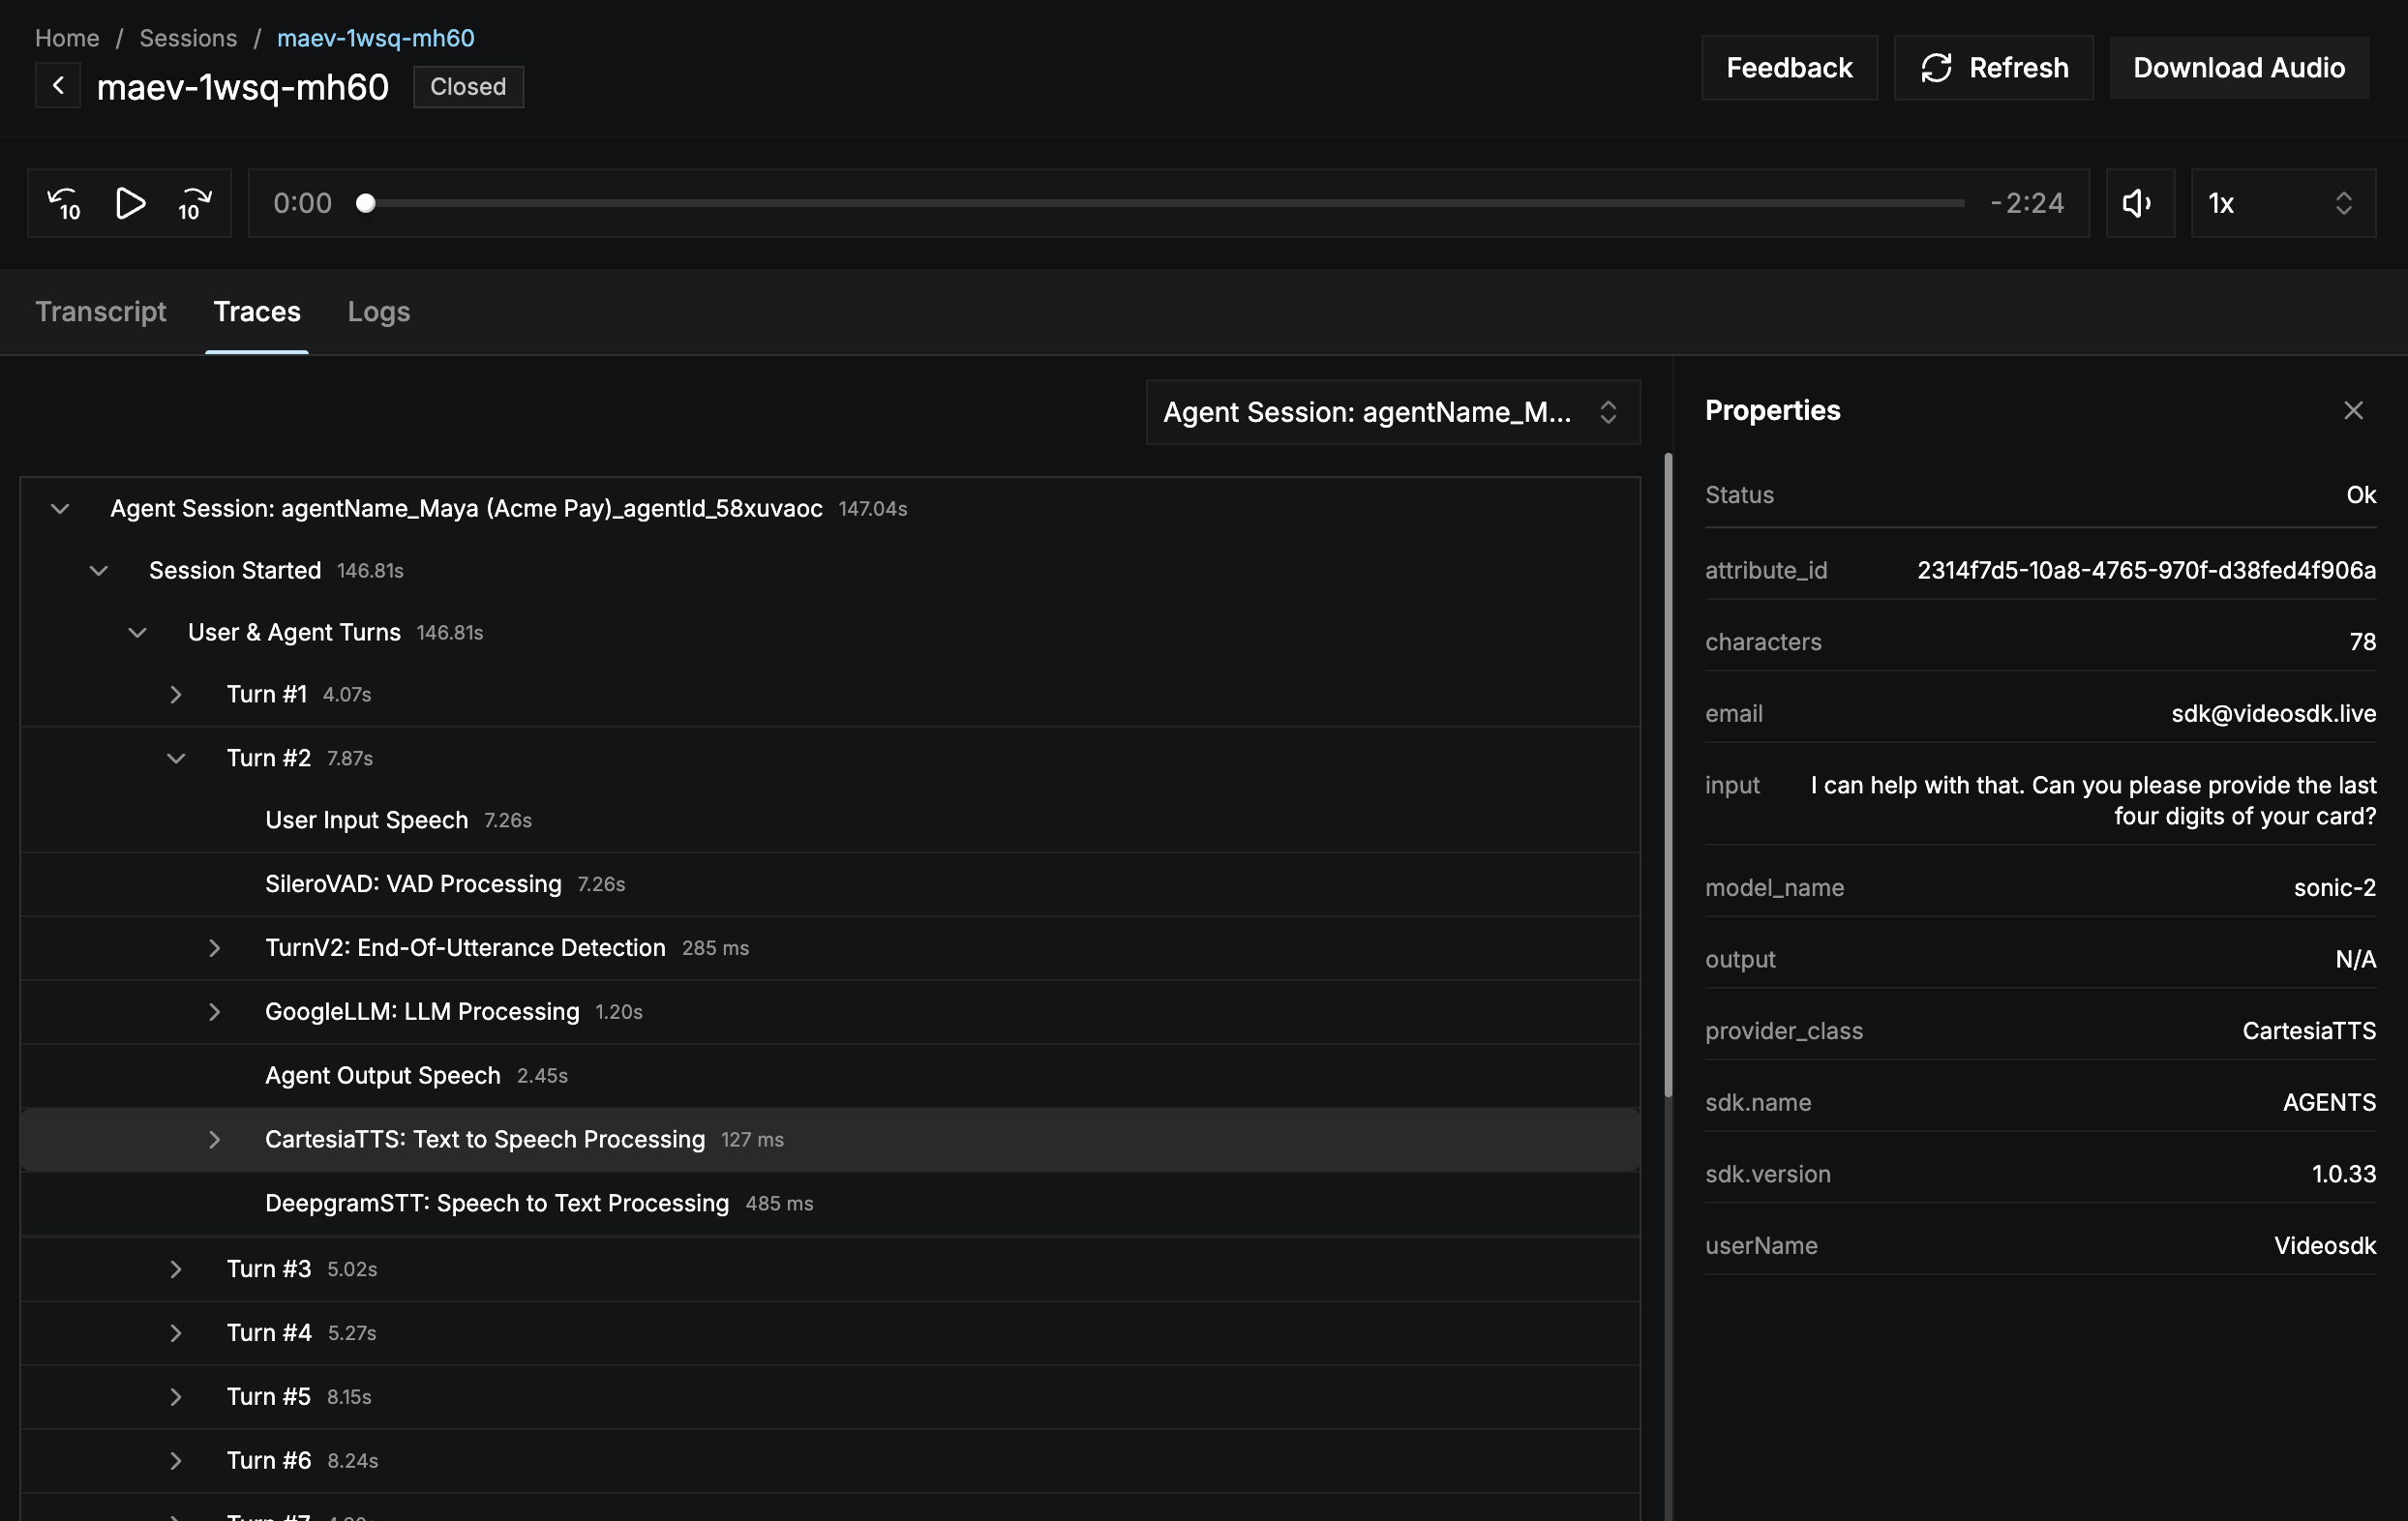
Span properties: the TTS span's input text, model, and provider in the Properties panel
Tool Calls
When the LLM invokes a tool, the call appears as an Invoked Tool:<tool name> span inside the LLM span. Its properties show the arguments the tool was called with, the result it returned, its latency, whether it failed (is_error), whether it is cancelled on interruption (cancel_on_interrupt), and its call_id. Use it to validate integrations and debug tool behavior.
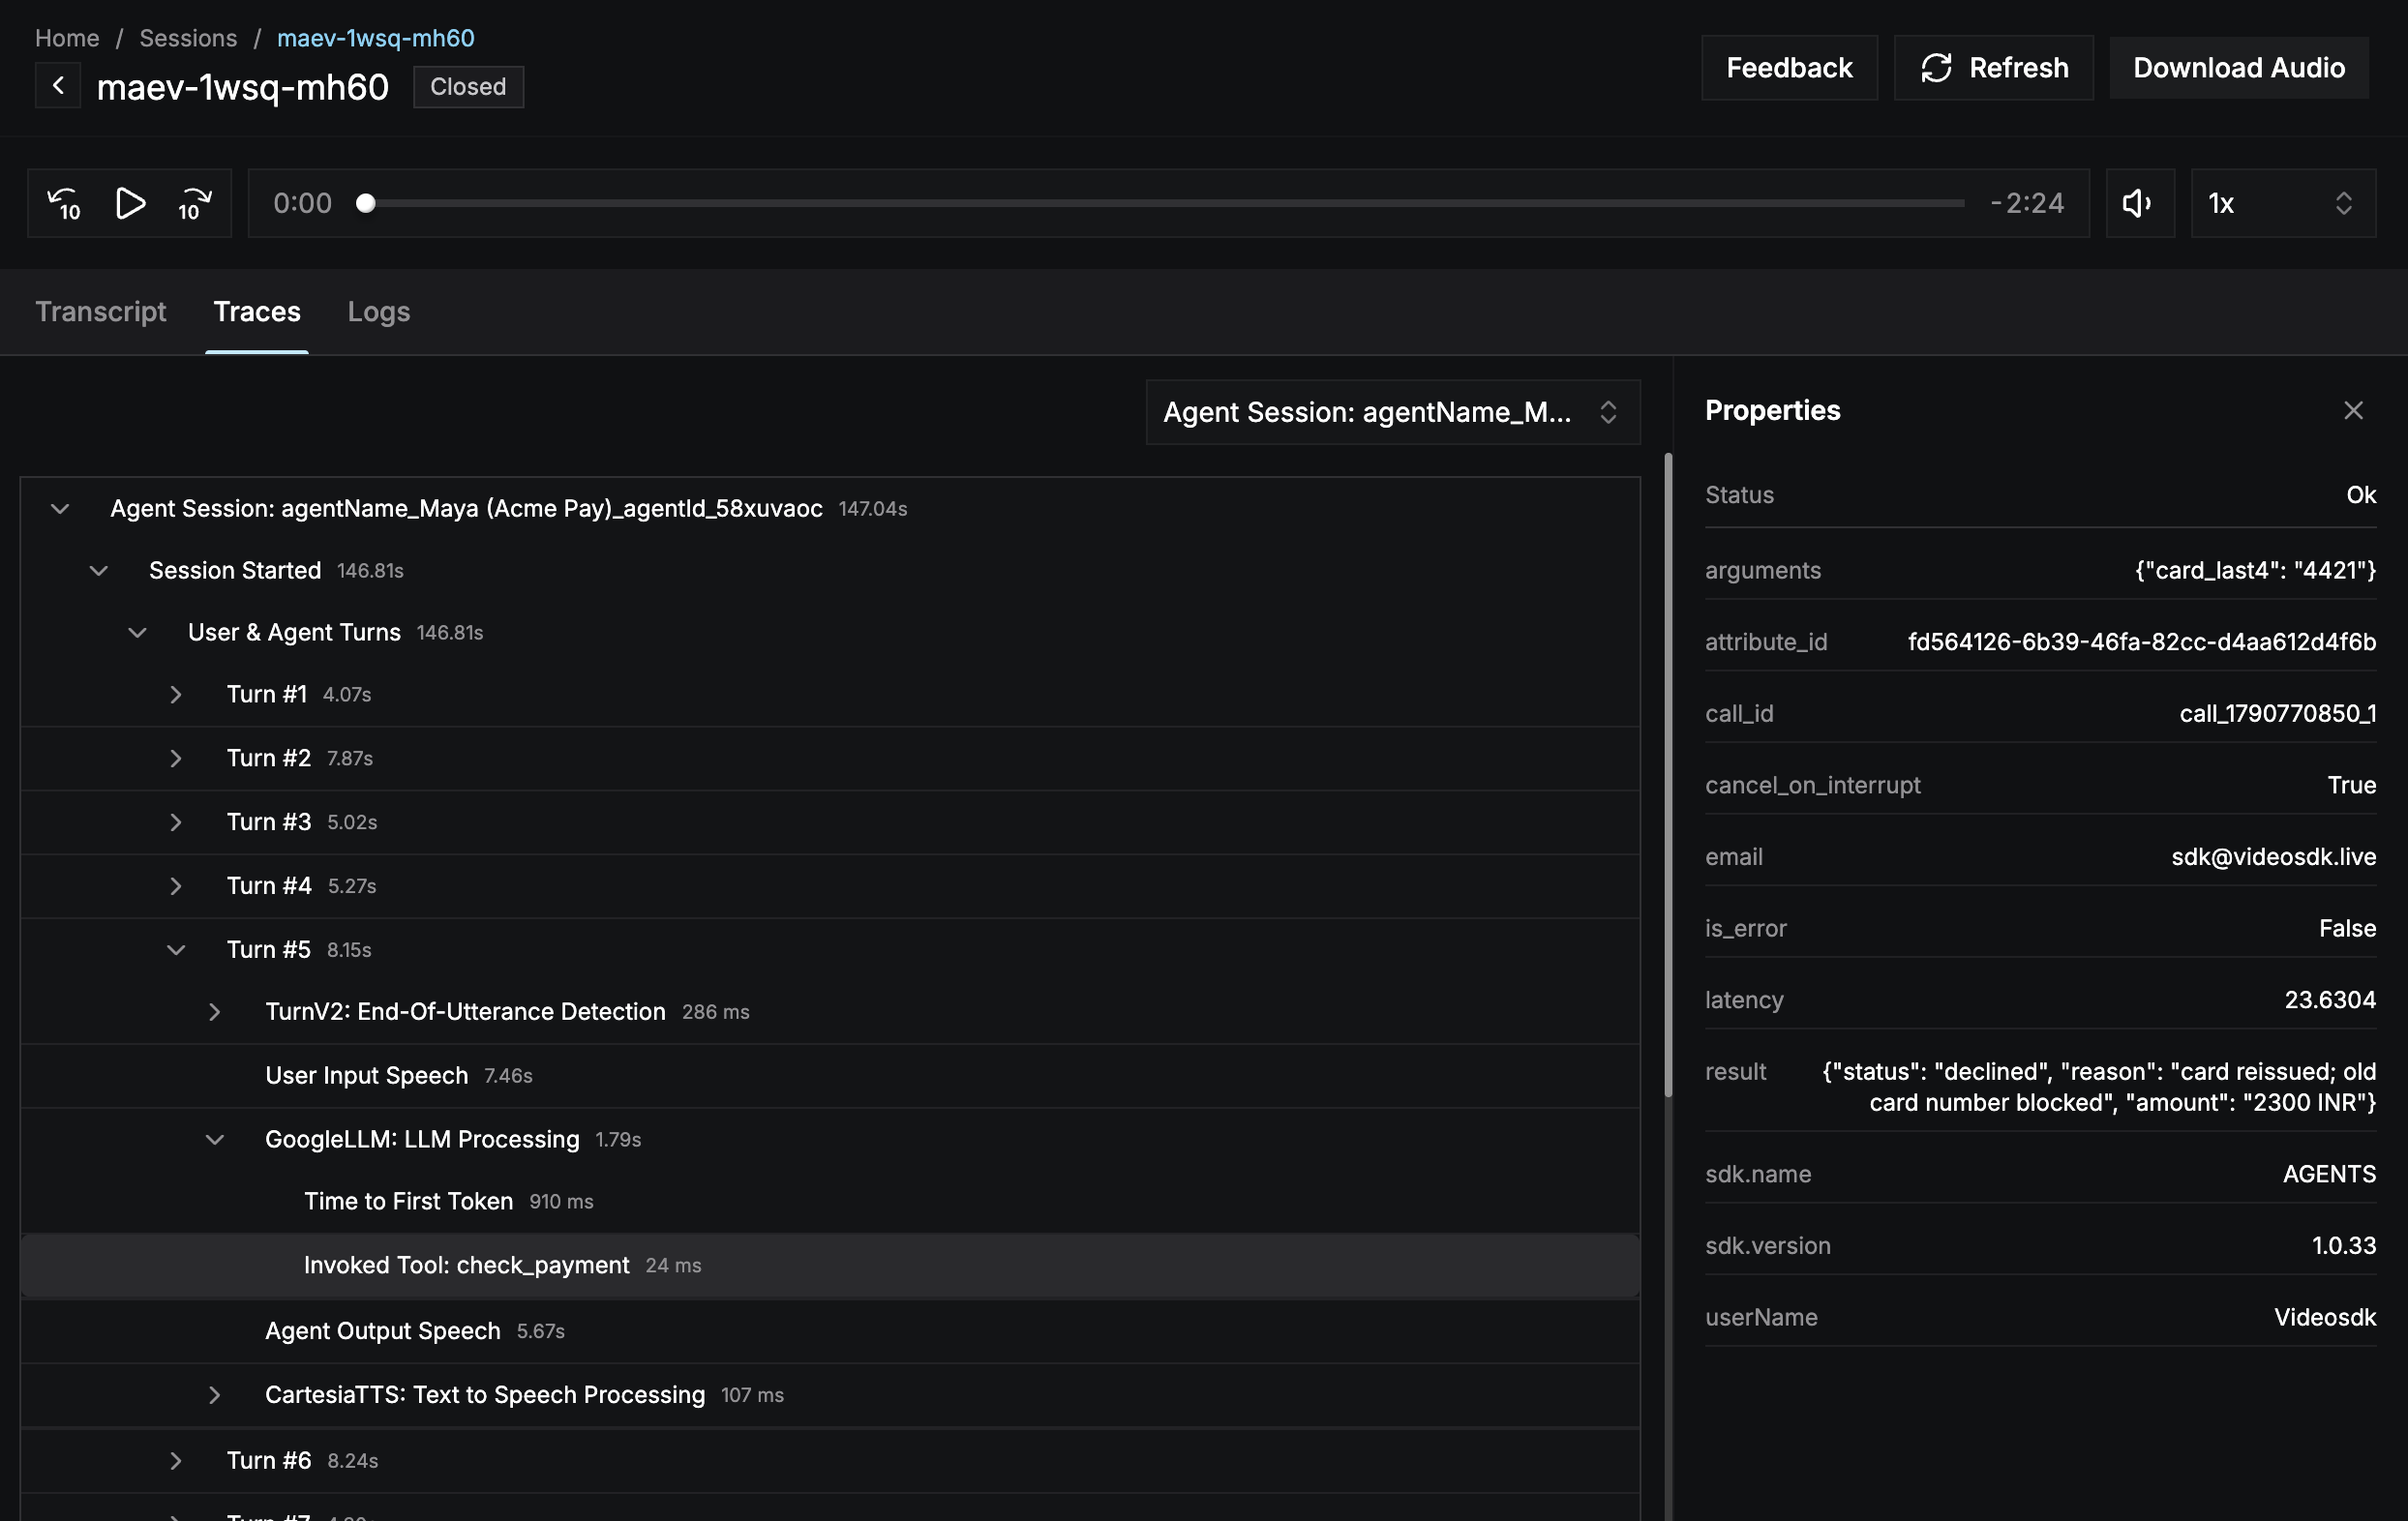
Tool call details: the arguments, result, and latency of an invoked tool
Export traces to your observability stack
To send traces to your own observability stack, such as Datadog, SigNoz, or New Relic, settraces on the room’s Observability to an Exporter that points at your collector’s OpenTelemetry (OTLP) endpoint.
Room on serve() to apply it to every session, or on invoke() to apply it to one session.
Leaving
traces unset is not the same as turning it off. An unset stream follows the runtime’s default settings. To stop exporting traces, pass Exporter(enabled=False).What’s Next
Metrics
Read per-stage latency and token usage.
Logs
Set the log level and ship agent logs to your stack.
References
- Python
- Node JS
Examples
Observability Hooks
Configure observability for a session.