

Sessions View
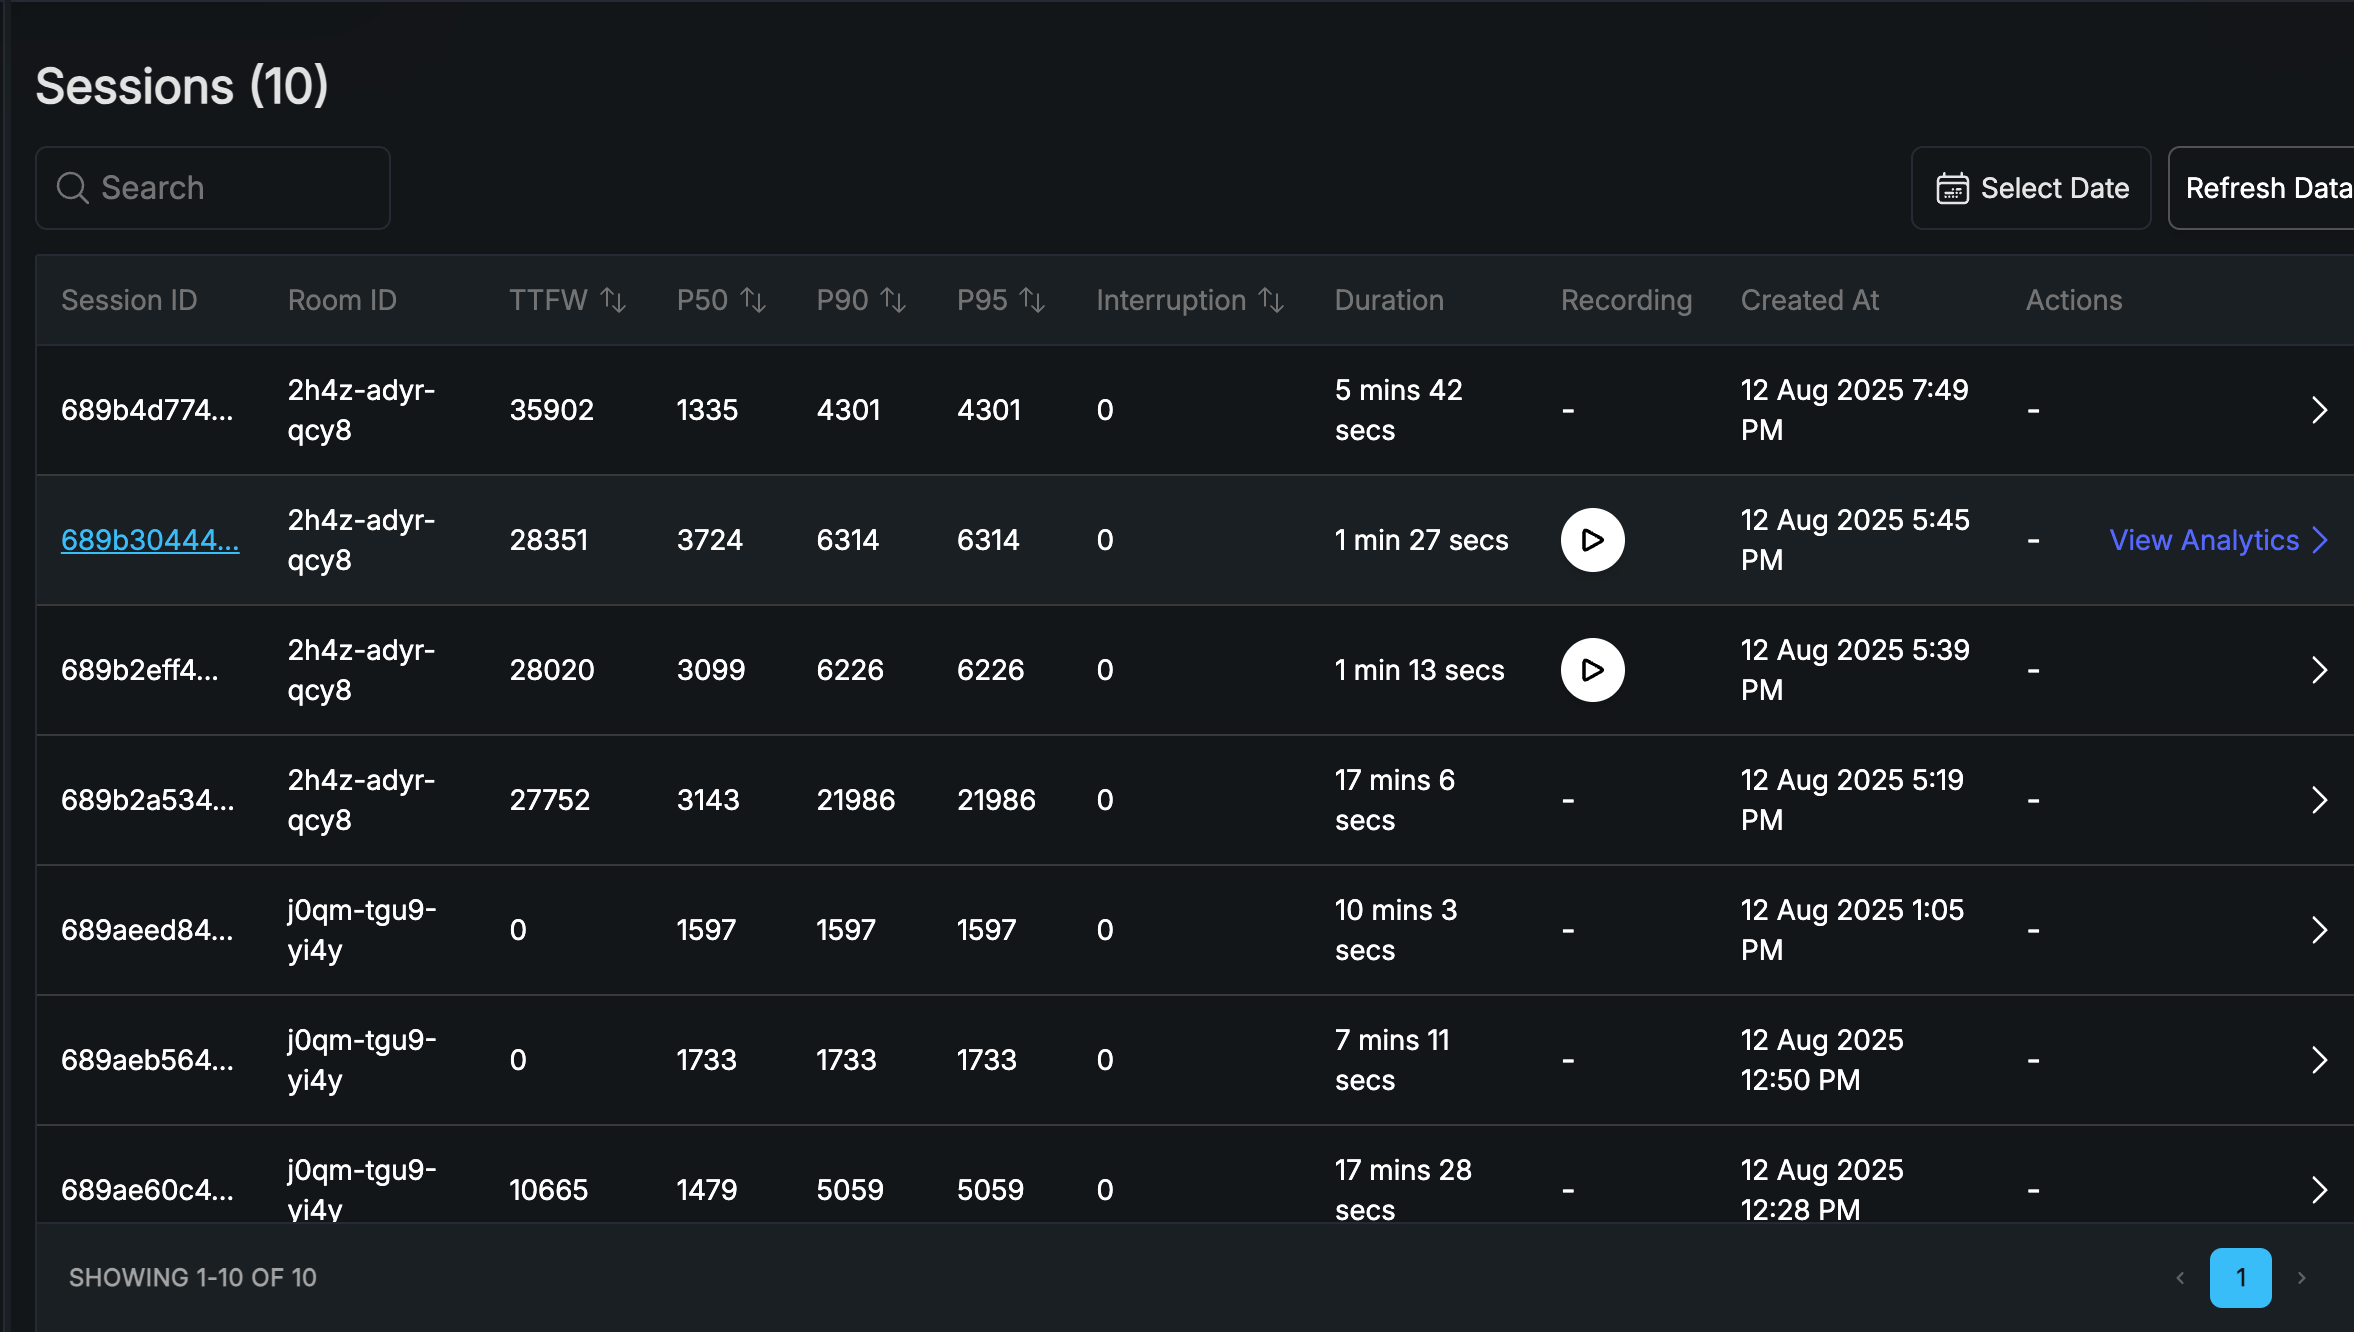
Sessions list on the Zero Runtime Dashboard
Session View
Click View Analytics to open the Session view. It shows the full transcript with timestamps and speaker labels (Caller and Agent), and plays back the recording with an autoscrolling transcript, so you can review the experience and spot areas to improve.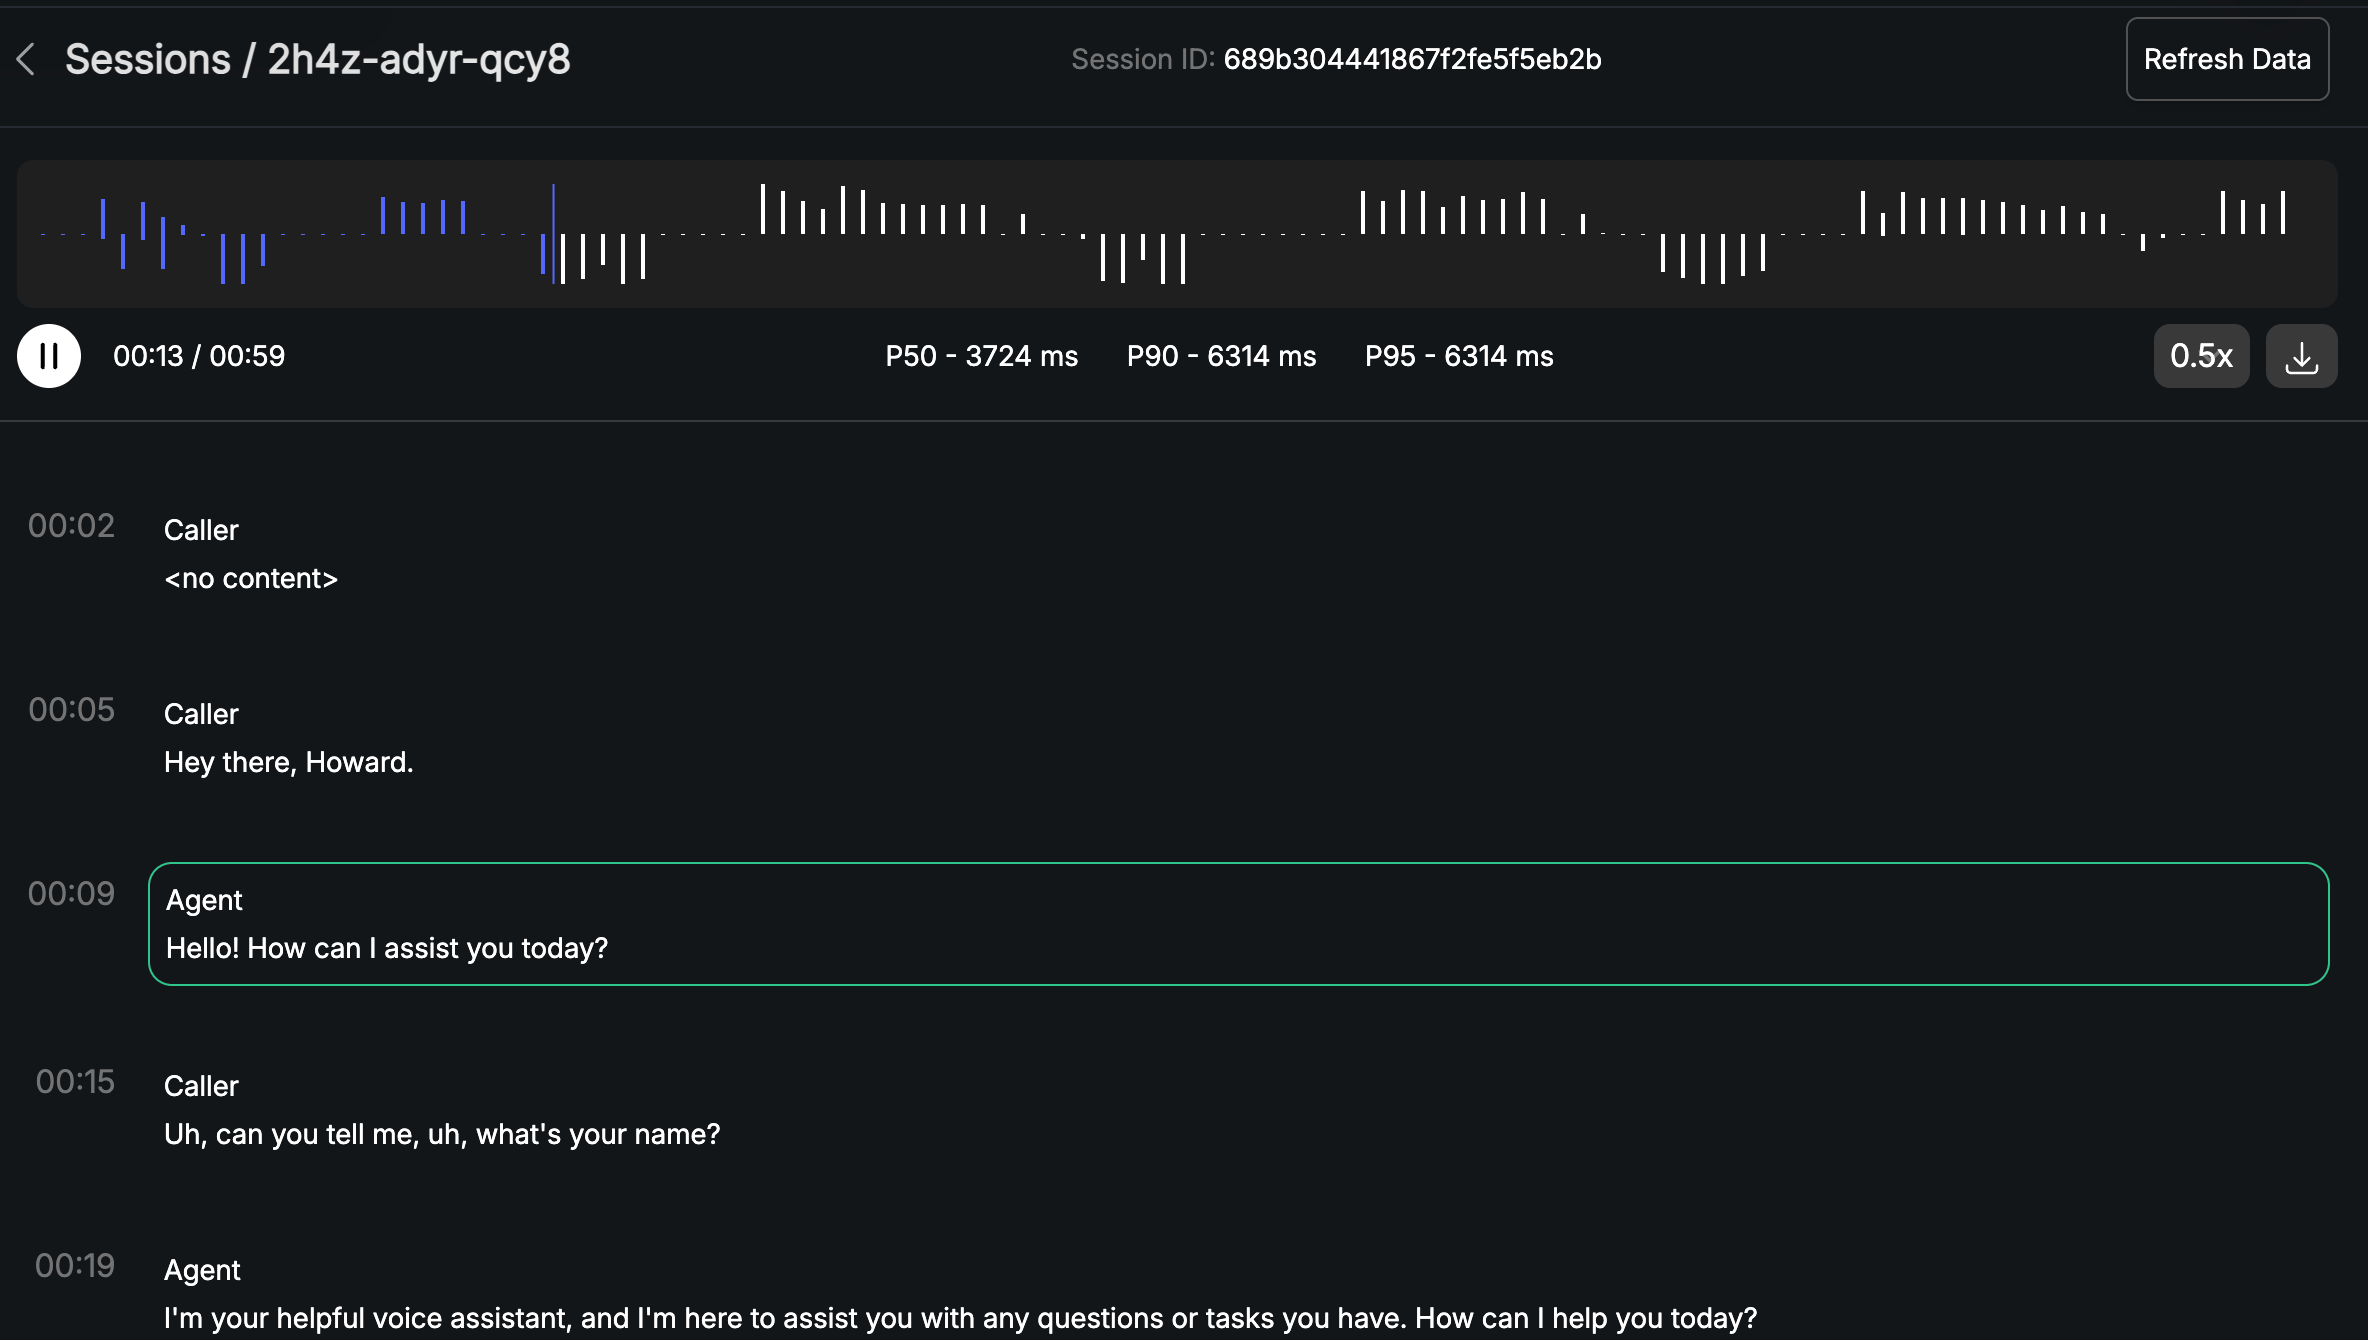
Session view with synchronized transcript and recording playback
What’s Next
Trace Insights
Drill into per-turn traces and spans.
Observability Options
Configure recording and review telemetry on the Dashboard.
References
- Python
- Node JS
Examples
Observability Hooks
Gather per-session analytics.