

Session Configuration
At the top level, the Session Configuration details every parameter the agent was initialized with: the STT, LLM, and TTS models, plus any function tools and MCP tools. Use it to reproduce and debug agent behavior.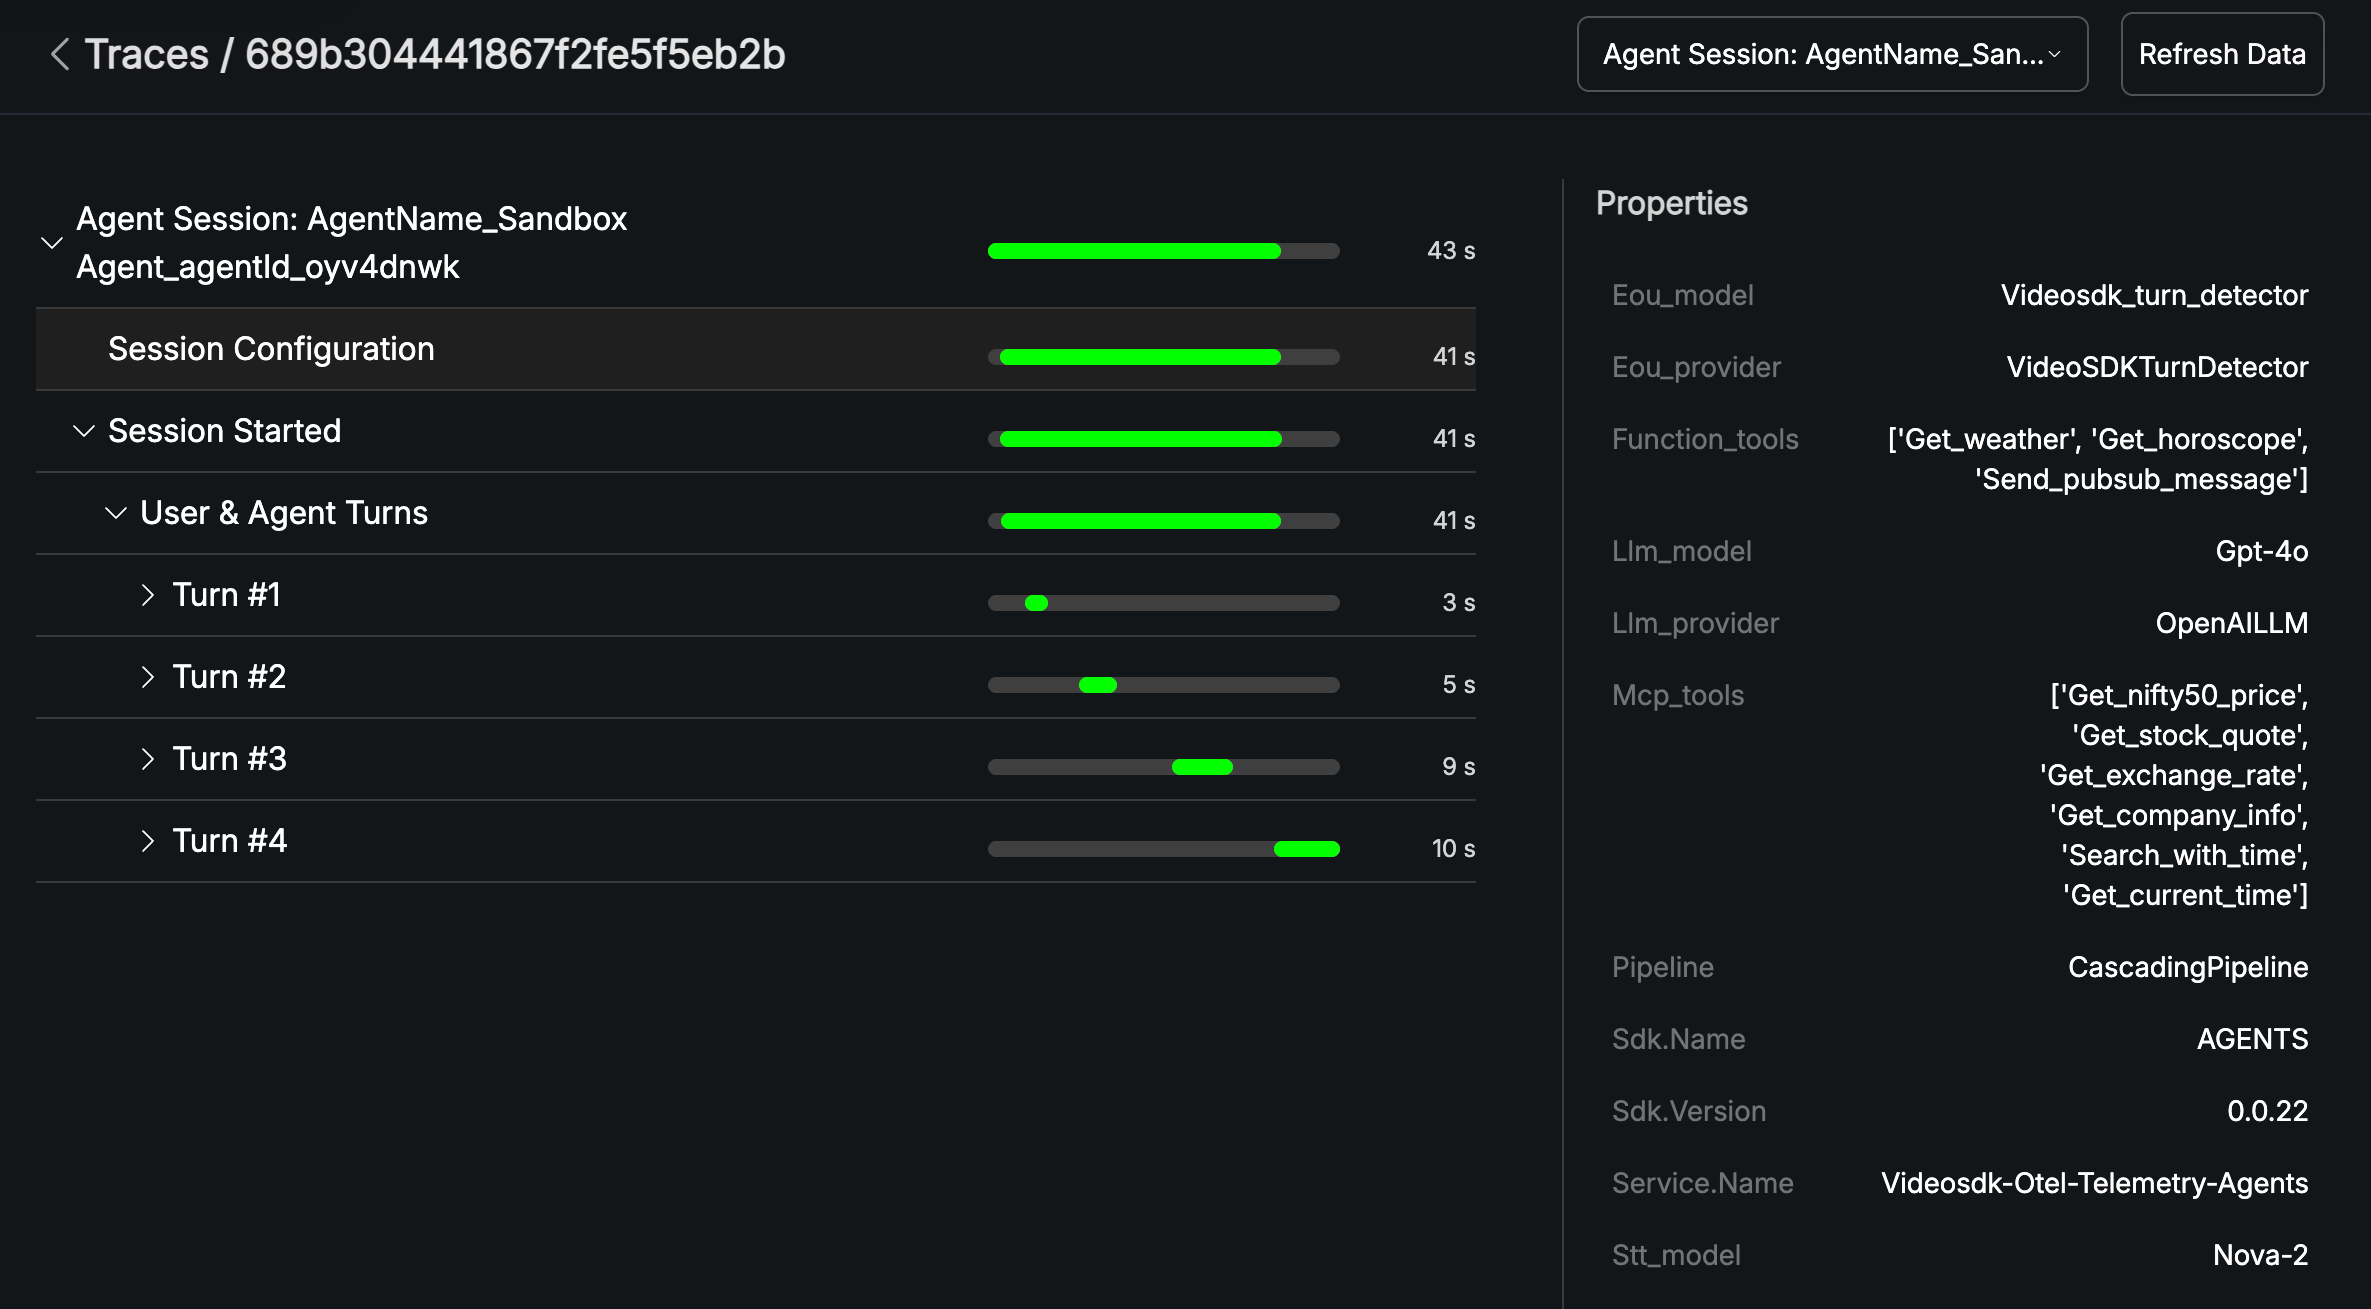
Session configuration in the Properties panel: STT, LLM, and TTS models plus function and MCP tools
User & Agent Turns
The core of the Trace View is the breakdown of the conversation into User & Agent Turns. Each turn is a single exchange between the user and the agent, with a detailed timeline of these spans: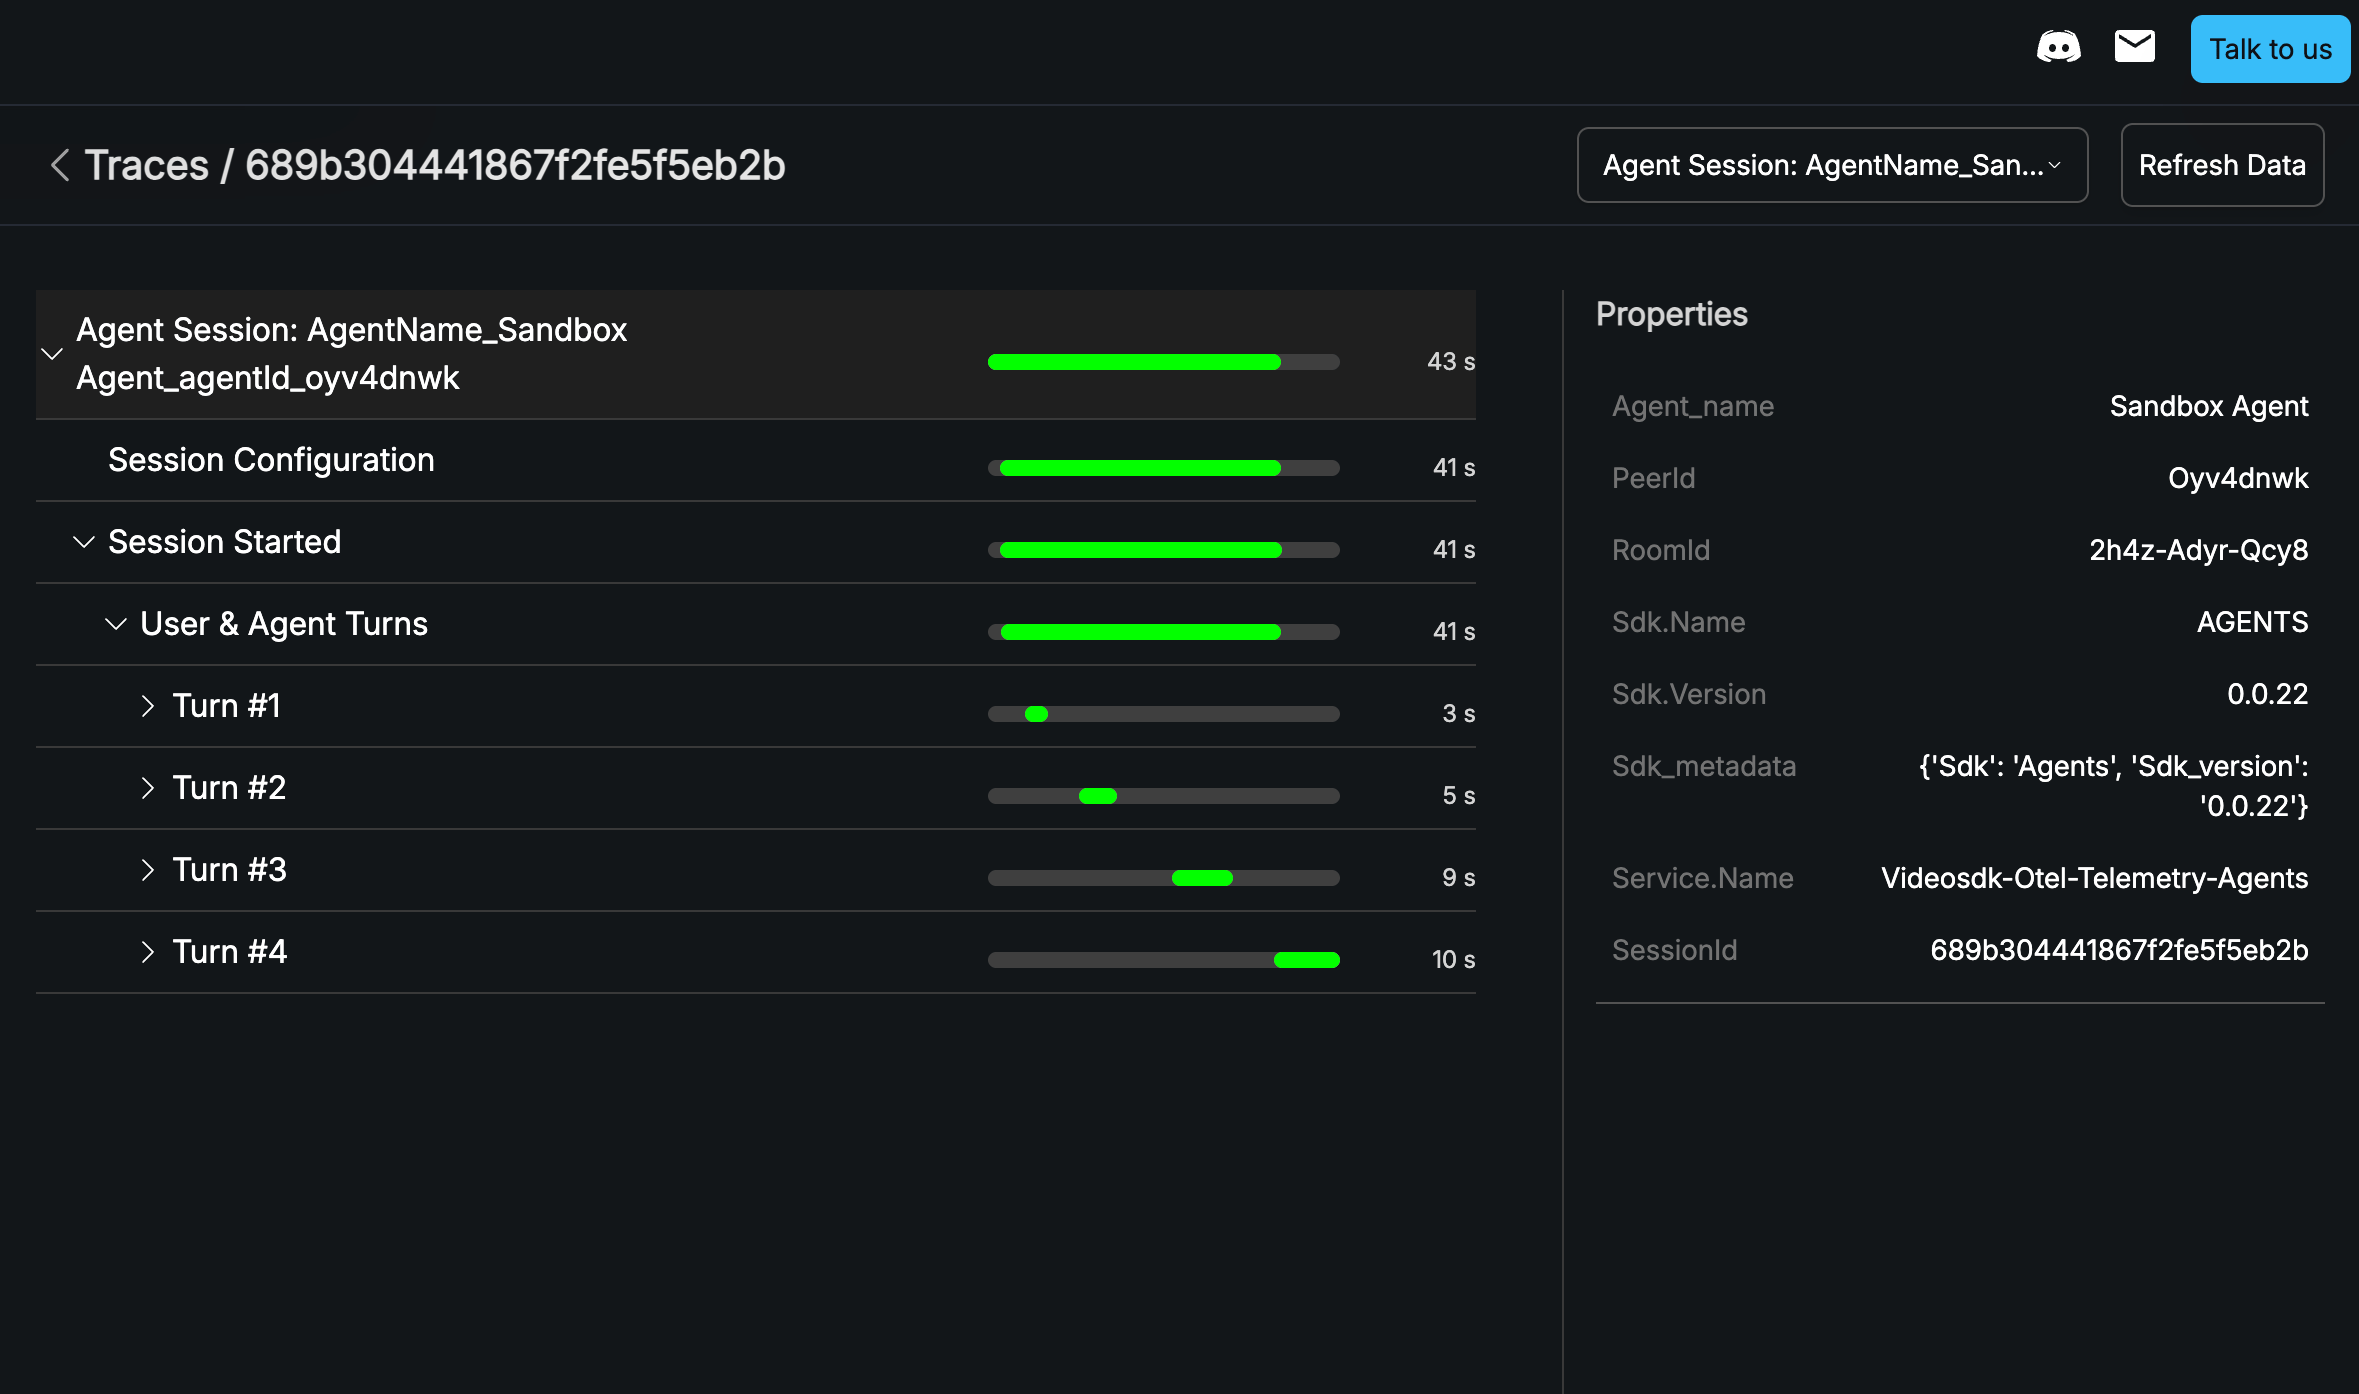
A turn expanded into its STT, EOU, LLM, and TTS spans
Turn Properties
For each turn, inspect the properties of the components involved: the transcript of the user’s input, the response from the LLM, and any errors that occurred.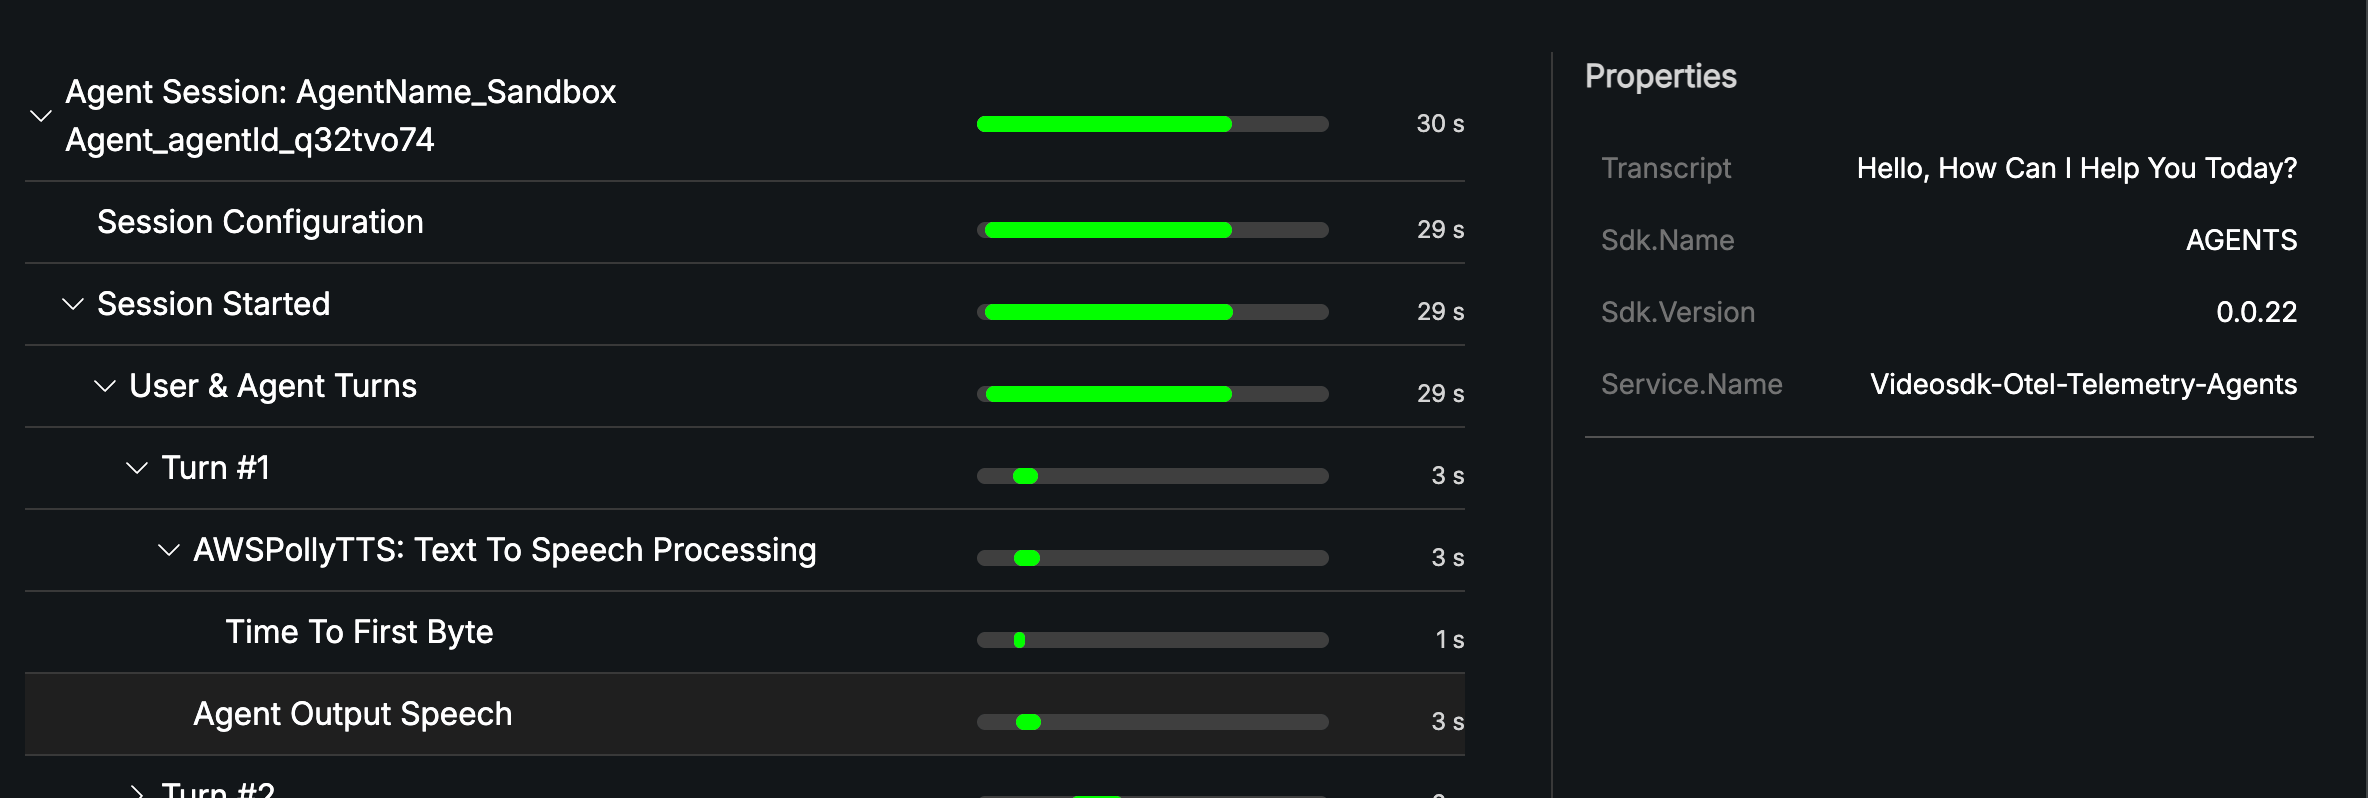
Turn properties: the input transcript and LLM response in the Properties panel
Tool Calls
When the LLM invokes a tool, the Trace View shows details about the call, including the tool’s name and the parameters it was called with. Use it to validate integrations and debug tool behavior.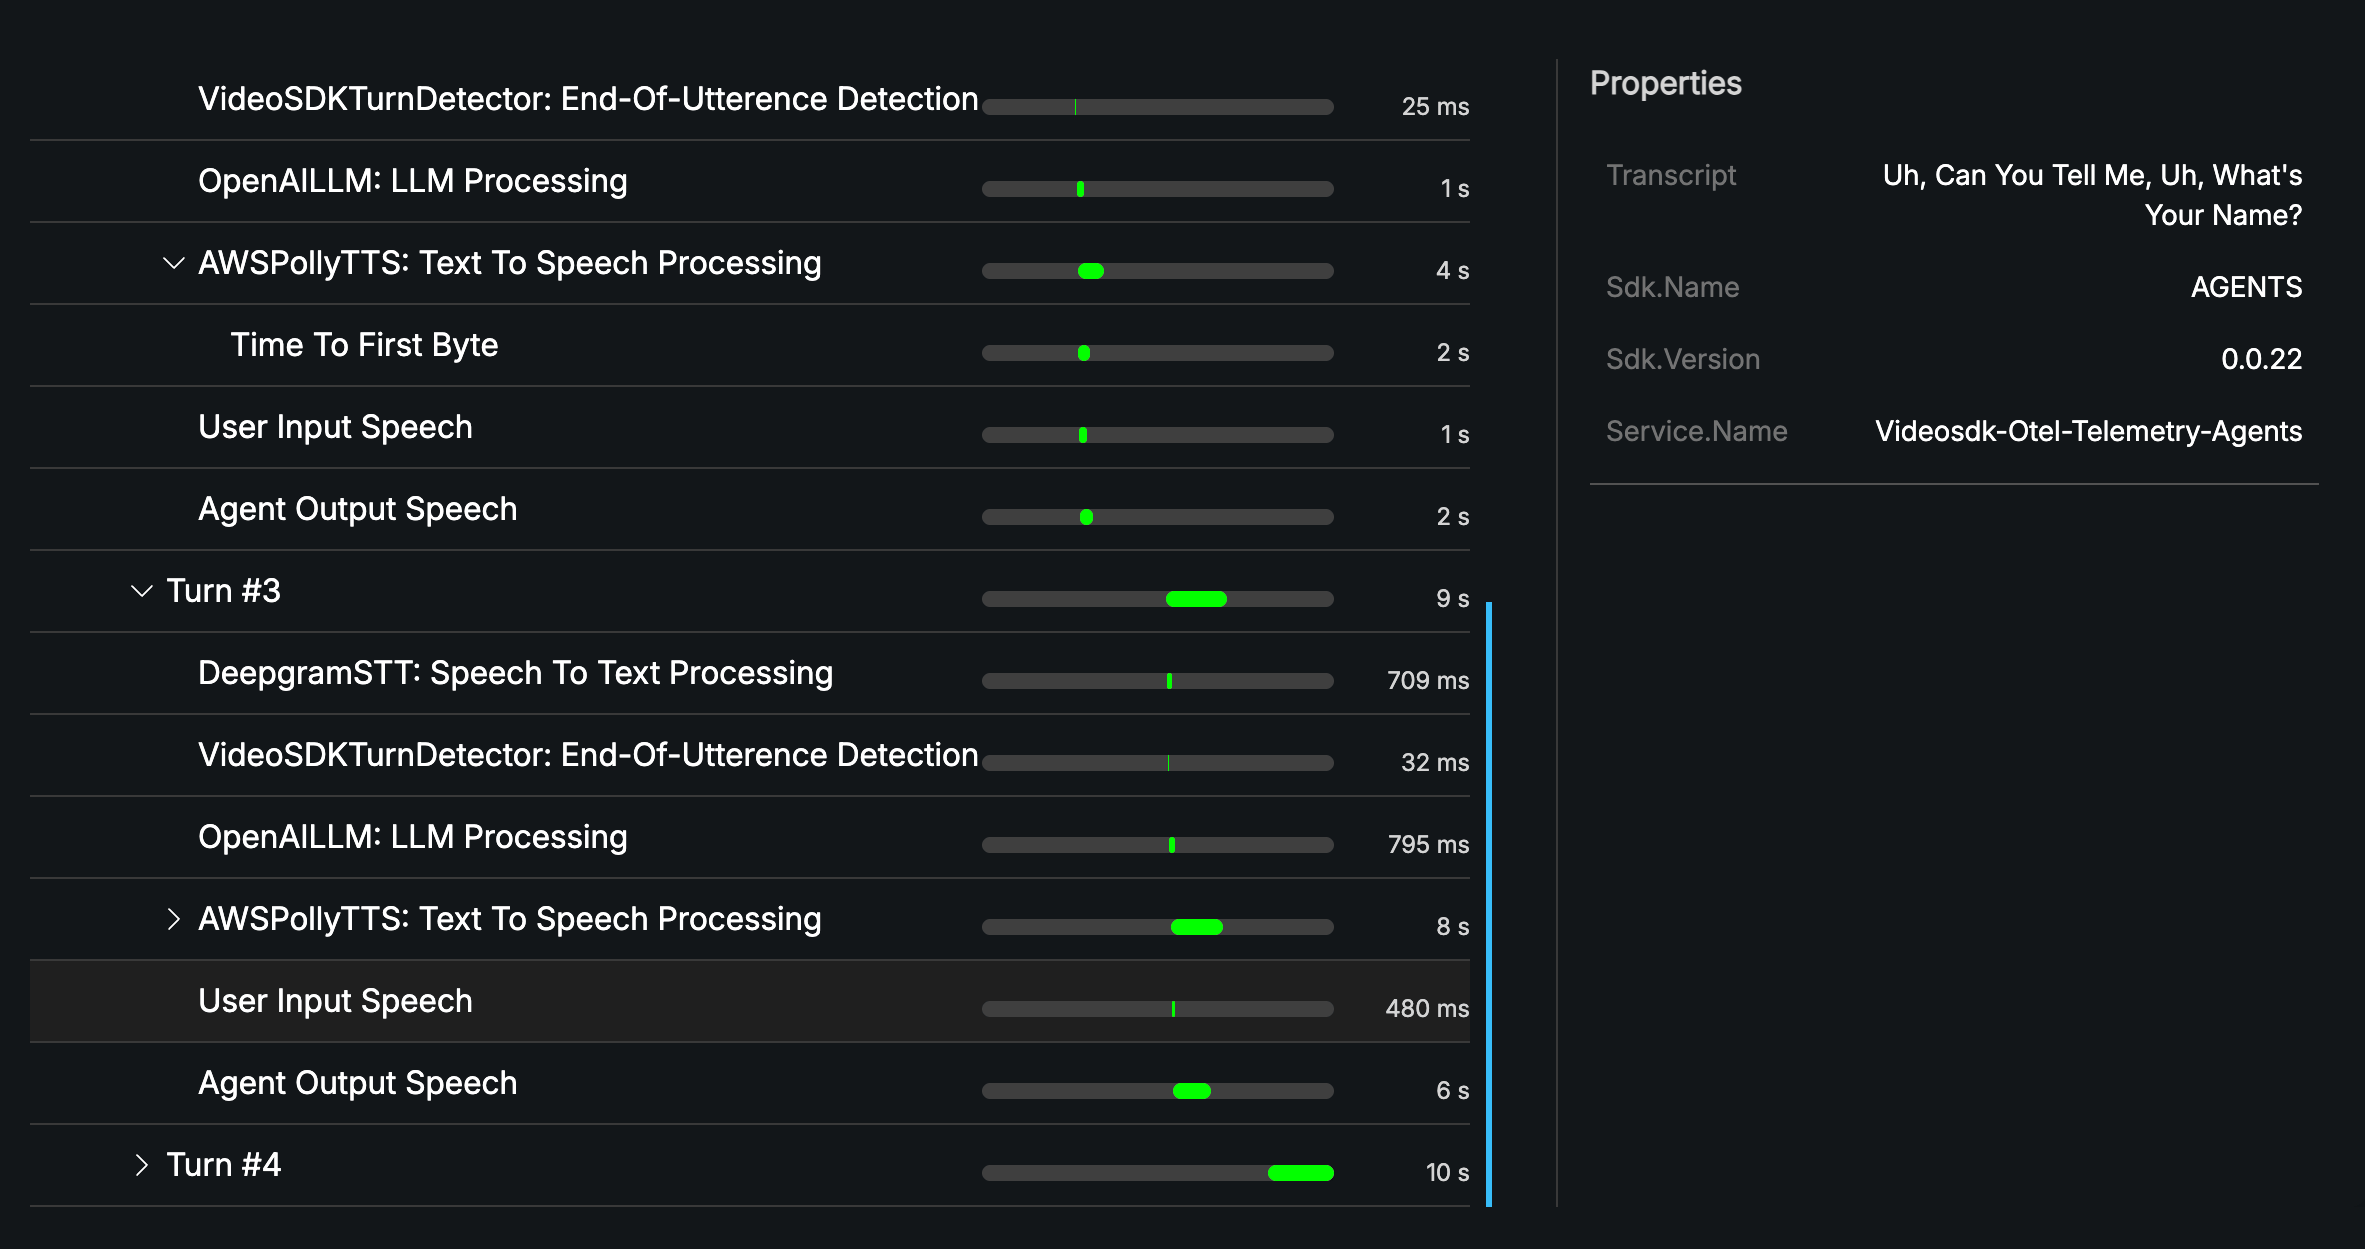
Tool call details: the tool name and the parameters it was invoked with
What’s Next
Observability Options
View per-turn traces and metrics on the Dashboard.
Session Analytics
See session-level metrics and transcripts.
References
- Python
- Node JS
Examples
Observability Hooks
Emit traces from a session.